Detecting Abnormal Angiogenesis in Nonhealing Wounds With ICG Microangiography
Indocyanine green fluorescence vascular angiography (FVA, or ICG imaging) provides a dynamic view of tissue perfusion at the microvascular level. FVA is employed intraoperatively in myriad surgical disciplines,1 in the assessment of traumatic wounds and burns,2 in tumor detection,3 and in lymphatic mapping.3,4 Logically, ICG imaging has been suggested for the clinical arena of problem wound healing5 and has proven effective.6 ICG imaging of nonhealing wounds affords a compelling portrayal of real-time tissue perfusion, and derivative analysis of the image data provides quantitative information of demonstrable utility in making treatment decisions.6 The ease with which FVA can be integrated into an active, multidisciplinary wound care clinic (WCC) has been demonstrated and the utilization of FVA in such venues is increasing. This article will offer some examples.
PREMISE
In the broad array of pathologies characterizing the arrested wound there is virtually always a disruption of normal tissue perfusion.7-9 This may be the uncomplicated mechanical obstruction of arterial inflow at one or many sites. Concomitantly, or as the sole proximate cause of poor wound bed perfusion, there can be an architectural microvascular disorder that effectively diverts blood from the actual capillary bed. The presence of pre-capillary arteriovenous shunting (A-VS) has been demonstrated in both diabetic and nondiabetic ischemia-threatened limbs.10,11 A persistent, unmodulated angiogenic stimulus emanating from a nonhealing wound may become a pathologic enabler by preventing the maturation of the normal neovascularization that is an essential component of wound repair.12,13
Several diagnostic devices have been developed to quantitatively assess tissue perfusion.14 In this communication, the ability of FVA to visualize wound/periwound perfusion is presented and its ability to guide therapeutic decisions is demonstrated. Following the intravenous injection of indocyanine green, the properties of a near-infrared laser light source and a charge-coupled device (CCD) camera are used to render and record the regional macro- and microvascular blood flow. FVA is readily adapted to the outpatient WCC environment and analysis of the derived imaging data contributes to the characterization of problem wounds as well as evaluating the efficacy of topical or interventional therapeutic efforts. Here, particular attention is directed towards FVA data analysis that reflects the microvascular derangements that prevent the sustentative perfusion of the wound bed necessary for normal healing — its capacity for unaided secondary healing, commonly referred to as CUSH.
CASE PRESENTATIONS
The archetypal indocyanine green fluorescence microangiogram of a chronic, nonhealing wound has been described,5,15 and is shown in Figures 1A and 1B. (For a video demonstration, visit the online version of this article at www.todayswoundclinic.com. See Video 1.) This CCD camera capture of the initial passage of ICG dye through the wound bed demonstrates the salient FVA components of nonhealing wounds:
- hyperfluorescence;
- a wide halo of hyperfluorescence;
- rapid attainment of the maximum intensity peak; here occurring at 19 seconds after the first appearance of the ICG dye.
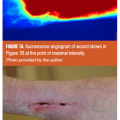
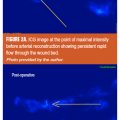
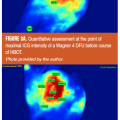
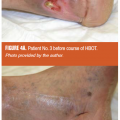
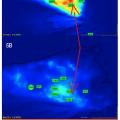
The second case illustrates how macrosurgical correction of arterial inflow restriction (a successful femoropopliteal bypass) did not correct one pathognomonic stigma of a nonhealing wound. Three weeks after the surgery, with this patient’s ankle-brachial index now at 0.87, there persists the rapid filling of the effluents vein just proximal to the wound at 12 seconds (Figure 2), both before and after the bypass surgery. (See Video 2 and Video 3 to view FVA recordings preoperatively and postoperatively simultaneously.) Despite the restoration of normal macrovessel inflow pressures, the persistence of the wound/periwound A-VS pattern prompted the early (and successful) amputation of the proximal phalanx with primary healing of the surgical site. The overall pattern of ICG movement through the wound bed also conveys information about healing potential and healing progress. In the next case, a limb-threatening Wagner’s Grade 3+ diabetic foot ulcer (DFU) was examined with fluorescence angiography before hyperbaric oxygen therapy (HBOT) and after completing 29 chamber sessions. In Figures 3A and 3B the snapshot harvested from the FVA sequence before HBOT shows a chaotic distribution of ICG dye and a maximum intensity at 19.80 seconds. After completing 29 HBOT sessions, the dye appearance is more orderly and the point of maximal intensity is delayed until 30.93 seconds. These two FVA sequences may be played simultaneously through Video 3 and Video 4 to not only confirm the markedly delayed maximum intensity peak, but to also provide an opportunity to gain a global impression of how the ICG movement pattern changes in immediate synchrony with the clinical improvement of the wound — well before final healing has taken place. The last case utilizes FVA visualization of the wound/periwound soft tissue to reinforce two concepts about the ICG pattern: its static expression at defined moments within the recorded sequence (point of maximal ICG concentration) and its dynamic, expressive (evocative) impact on the viewing provider. Both provide reliable, communicable information that contributes to effective patient management decisions. Figures 4A and 4B show a complex lower extremity wound that developed at a previous musculocutaneous flap inset site. There is exposed, calcified Achilles tendon. Figure 5A shows single-frame exports from FVA studies at the patient’s presentation and after complete, stable healing. Figure 5B mirrors those digital photographs with single-frame exports from the FVA sequences harvested at the peak-recorded ICG intensity. Geographically matched individual sites are certainly representative of the two distinct FVA events and can be quantitated (as shown here with the red arrow). However, viewing the two recordings time-linked and playing simultaneously makes the contrast between the untreated wound and its healed state even more vivid. (See Video 5 and Video 6)
CLINICAL RELEVANCE
At the risk of oversimplification, the pathologic microvascular FVA hallmarks of the nonhealing wound appear to be: 1) hyperfluorescence extending well beyond the wound margins; 2) early appearance of the maximum fluorescence; and 3) evanescence of that hyperfluorescence. The unitary concept that explains these findings is the presence of high-flow, high-velocity aberrant A-VS channels within the wound bed and the periwound soft tissue. Further, the recrudescence of these stigmata demonstrates that effective treatment is being delivered and that those abnormal vascular channels are being remodeled. The application of this diagnostic modality is quite nascent and the current derivative analyses of FVA sequences are also in their infancy. However, in these examples we see:
- The continuing presence of high-velocity, divergent perfusion pathways even after successful revascularization of an ischemic extremity (case No. 1), arguing that uneventful secondary healing would not ensue. This led to an early, limited, and successful toe amputation.
- In the second case, a complex DFU well managed with surgical debridement, aggressive topical case, and HBOT had sufficient normalization of the ICG imaging study that further HBOT was deemed unnecessary after only 29 chamber sessions.
- The final case parallels the course seen in the second patient. The initial plan was to surgically prepare the wound site, perform a free flap for soft tissue coverage, and use HBOT only adjunctively, if needed. The patient declined any surgery, understanding the limb-risk this imposed, but did agree to daily HBOT. Longitudinal FVA studies affirmed progress was being made with this regimen and further confirmed the healed, stable wound site no longer manifested any ICG imaging propensity for recurrence.
These early experiences are just that, individual examples of where this diagnostic implement proved useful in the management of complex wounds. Extensive clinical experience is needed before rigorous treatment guidelines evolve. However, the visual scrutiny of, and the derivative mathematical analysis of, these FVA images clearly can be used in clinical decision-making. The potential for such analyses to affect improved patient outcomes as well as more efficient utilization of medical resources compels us to continue.
Stephen D. Guthrie (stephen_guthrie@mac.com) is president and Barbara R. Guthrie is chief executive officer of Designed Altobaric Research Foundation; Livonia, MI.
References
1. Kamolz LP, Andel H, Auer T, Meissl G, Frey M. Evaluation of skin perfusion by use of indocyanine green video angiography: Rational design and planning of trauma surgery. J Trauma. 2006;61(3): 635-641.
2. Kaiser M, Yafi A, Cinat M, Choi B, Durkin AJ. Noninvasive assessment of burn wound severity using optical technology: A review of current and future modalities. Burns. 2011;37(3): 377–386.
3. Marshall MV, Rasmussen JC, Tan IC. Near-infrared fluorescence imaging in humans with indocyanine green: A review and update. Open Surg Oncol J. 2012;2(2):12–25.
4. Alander JT, Kaartinen I, Laakso A. A review of indocyanine green fluorescent imaging in surgery. J Biom Imag Arch. 2012; 2012:940585. doi: 10.1155/2012/940585.
5. Guthrie SD, Salzberg AS, Hourani H, Rogers C. Indocyanine green scanning: Emerging metrics of wound analysis and hyperbaric oxygen treatment efficacy. Undersea and Hyperbaric Medical Society. ASM. 2014;41(5):468.
6. Guthrie SD, Guthrie BR. Utilizing indocyanine green wound imaging in the management of hyperbaric therapy. TWC. 2014; 8(8):19-22.
7. Grey JE, Harding KG, Enoch S. Pressure ulcers. BMJ. 2006;332(7539):472-5.
8. Brem H, Tomic-Canic M. Cellular and molecular basis of wound healing in diabetes. J Clin Invest. 2007;117(5):1219–1222.
9. Diegelmann RF, Evans MC. Wound healing: An overview of acute, fibrotic, and delayed healing. Front in Biosci. 2004; 9;283-289,
10. Jörneskog G, Brismar K, Fagrell B. Skin capillary circulation severely impaired in toes of patients with IDDM, with and without late diabetic complications. Diabetologia.1995;38(4):474-480.
11. Jörneskog G. Why critical limb ischemia criteria are not applicable to diabetic foot and what the consequences are. Scand Journal of Surg. 2012;101(2):114-118.
12. Folkman J. Endogenous angiogenesis inhibitors. APMIS. 2004;112(7-8):496–507.
13. Brönneke S, Brückner B, Söhle. Genome-wide expression analysis of wounded skin reveals novel genes involved in angiogenesis. Angiogenesis. 2015;18(3):361-371. doi: 10.1007/s10456-015-9472-7. Epub May 28, 2015.
14. Paul DW, Ghassemi P, Ramella-Roman JC. Noninvasive imaging technologies for cutaneous wound assessment: A review. Wound Rep Reg. 2015;23(2):149–162. doi: 10.1111/wrr.12262.
15. Lepow BD, Perry D, Armstrong D. The use of SPY intra-operative vascular angiography as a predictor of wound healing. Podiatry Manage. June/July 2011;141-148.


