

Lesion Flow Coefficient: A Combined Anatomical and Functional Parameter for Detection of Coronary Artery Disease — A Clinical Study
Abstract: Invasive diagnosis of coronary artery disease utilizes either anatomical or functional measurements. In this study, we tested a futuristic parameter, lesion flow coefficient (LFC, defined as the ratio of percent coronary area stenosis (%AS) to the square root of the ratio of the pressure drop across the stenosis to the dynamic pressure in the throat region), that combines both the anatomical (%AS) and functional measurements (pressure and flow) for application in a clinical setting. In 51 vessels, simultaneous pressure and flow readings were obtained using a 0.014˝ Combowire (Volcano Corporation). Anatomical details were assessed using quantitative coronary angiography (QCA). Fractional flow reserve (FFR), coronary flow reserve (CFR), hyperemic stenosis resistance index (HSR), and hyperemic microvascular index (HMR) were obtained at baseline and adenosine-induced hyperemia. QCA data were corrected for the presence of guidewire and then the LFC values were calculated. LFC was correlated with FFR, CFR, HSR, and HMR, individually and in combination with %AS, under both baseline and hyperemic conditions. Further, in 5 vessels, LFC group mean values were compared between pre-PCI and post-PCI groups. P<.05 was considered statistically significant. LFC measured at hyperemia correlated significantly when the pressure-based FFR, flow-based CFR, and anatomically measured %AS were combined (r = 0.64; P<.05). Similarly, LFC correlated significantly when HSR, HMR, and %AS were combined (r = 0.72; P<.05). LFC was able to significantly distinguish between pre-PCI and post-PCI groups (0.42 ± 0.05 and 0.05 ± 0.004, respectively; P<.05). Similar results were obtained for the LFC at baseline conditions. LFC, a futuristic parameter that combines both the anatomical and functional endpoints, has potential for application in a clinical setting for stenosis evaluation, under both hyperemic and baseline conditions.
J INVASIVE CARDIOL 2015;27(1):54-64
Key words: coronary artery disease, anatomical and functional diagnosis, lesion flow coefficient, FFR, CFR, catheterization
__________________________________________________________________
 Coronary artery disease (CAD) is one of the leading causes of death in the United States.1,2 CAD consists of diseases in both the large coronary (epicardial) arteries and the microvasculature supplying blood to the myocardium. While diagnosis of CAD has generally focused on assessing epicardial blockages (stenosis), the evaluation of microvascular disease has been a challenge.3-5 In particular, concomitant epicardial and microvascular impairments are even more difficult to diagnose. Currently, invasive angiography is routinely used to diagnose significant coronary epicardial stenosis. Therapeutic decisions during coronary angiography are initially based on visual assessment of the lesion. The lesions that are anatomically ambiguous are often further assessed for the functional severity of the stenosis. American Heart Association/American College of
 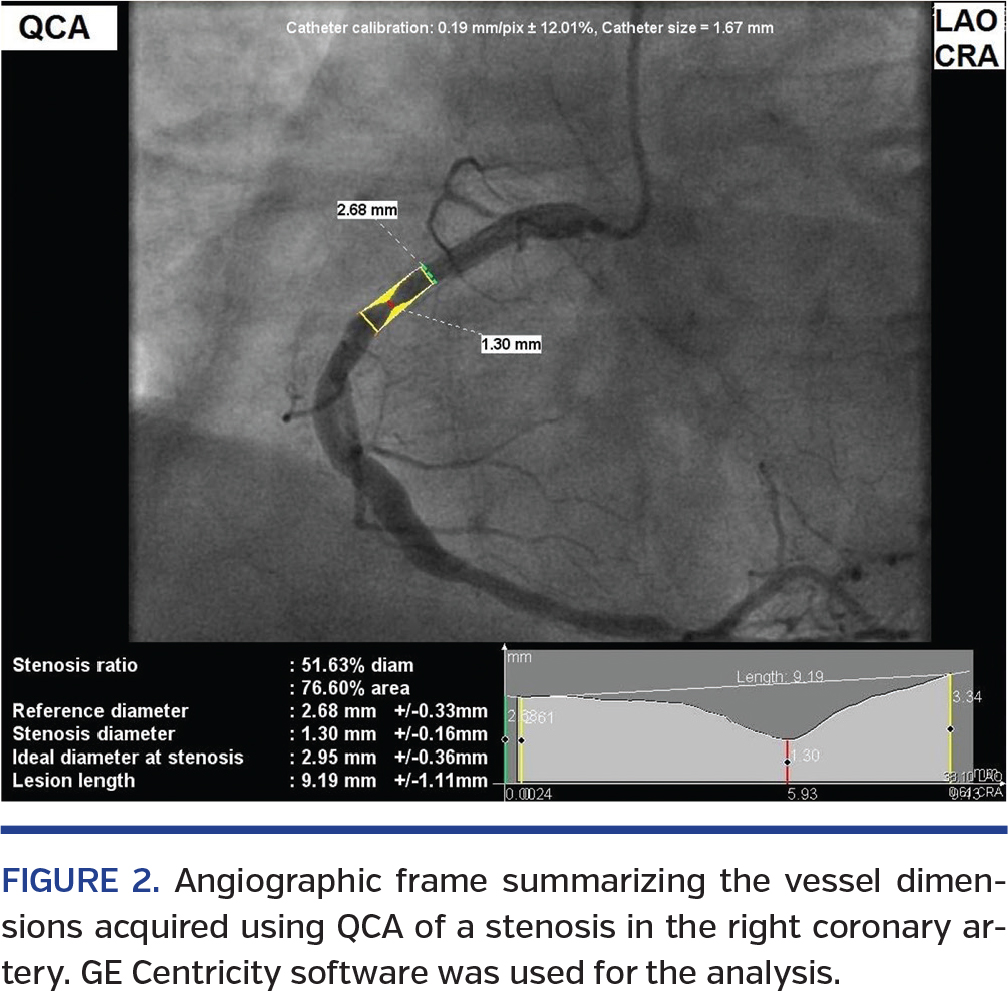 Cardiology guidelines6,7 suggest that a visually ambiguous intermediate stenosis (>50% diameter or >75% area stenosis) may need to be further evaluated using either the functional measure, the pressure-based fractional flow reserve (FFR), or the anatomical measure, intravascular ultrasound (IVUS). In general, visually mild and severe stenoses (~ >90% area stenosis) are not assessed using functional measurements. In this study, we tested a diagnostic parameter, the lesion flow coefficient (LFC), which combines both anatomical and functional measures. A brief introduction of the currently available functional and anatomical measures is given below.
 Functional (pressure and flow) diagnostic parameters. In order to evaluate the functional severity of the intermediate stenosis, various diagnostic parameters have been proposed. FFR (the ratio of pressure distal to the stenosis to the pressure proximal to the stenosis) is the current gold standard for evaluating the functional significance of an epicardial stenosis.8-10 It is a dimensionless parameter with a range from 0 (completely occluded artery) to 1 (normal artery). Based on several clinical trials, a cut-off value of FFR <0.759 for a single-vessel stenosis and FFR <0.88,10 for multivessel stenoses is considered significant for performing a percutaneous coronary intervention (PCI). Another parameter is the flow-based coronary flow reserve (CFR),11,12 which is defined as the ratio of flow at hyperemia to the flow at rest. A CFR value <2 is indicative of flow abnormality in the myocardium.
 With the advancements in guidewire technology,13,14 new diagnostic parameters that combine both pressure and flow have been recently introduced. The hyperemic stenosis resistance (HSR) index, defined as the ratio of pressure drop across the stenosis (Δp) to the average peak velocity (APV),15,16 was recently developed to delineate different levels of epicardial stenosis. Furthermore, in order to assess microvascular resistance, hyperemic microvascular resistance (HMR) index17 and index of microvascular resistance (IMR)18 have also been developed. HMR is defined as the ratio of pressure distal to the stenosis (Pd) to the APV, while IMR is defined as the product of Pd and mean transit time measured using thermodilution technique.
 Anatomical methods. In addition to functional measurements, quantification of stenosis severity is conducted using existing methods like quantitative coronary angiography (QCA)19-22 and emerging modalities like IVUS23,24 and optical coherence tomography (OCT).25-29 QCA requires angiography followed by two-dimensional (2D) and three-dimensional (3D) image assessment techniques to obtain the vessel and stenosis diameters, length, and projected diameter, accounting for the tapering of the arteries. On the other hand, IVUS and OCT use catheters within the target artery to obtain the lesion geometry.
 Shortcomings of current functional parameters. The hemodynamics of CAD involve a complex interplay between the pressure and flow variations due to the presence of microvascular dysfunction and epicardial stenosis.30-32 The FFR has been known to diagnose the severity of epicardial stenosis. However, it should be noted that in the presence of downstream microvascular disease, there is a reduction in the flow and an increase in the distal pressure. Therefore, FFR can be overestimated or severity of epicardial stenosis is underestimated. Under such a scenario, maximal hyperemia cannot be achieved,33 as has been observed in the presence of microvascular impairment. While CFR can quantify the flow capacity of the entire coronary vasculature, it does not distinguish if a flow impediment is caused by the epicardial conduit or the microvascular bed. HSR has been defined for delineating epicardial stenosis alone, while HMR and IMR have been defined for assessing the microvascular resistance alone. These parameters have a linear velocity term in the denominator. Such a linear term is more appropriate for diffuse (non-focal) lesion with gradual area change. Furthermore, HSR, HMR, and IMR have atypical units (mm Hg • s cm-1, mm Hg • s cm-1, and mm Hg • s, respectively). Therefore, a single parameter that can simultaneously account for the presence of epicardial stenosis and microvascular disease is currently lacking.
 Fluid-dynamic based parameters. In view of the above shortcomings, two non-dimensional parameters based on fundamental fluid dynamics principles have been introduced. The first parameter, pressure drop coefficient (CDP), the ratio of transstenotic pressure drop to distal dynamic pressure, combines both pressure and flow measurements. It has a wider range of 0~1000. It has been extensively validated in preclinical trials.34-40 In a recent study, CDP has been evaluated for clinical application.41
 The second parameter, and focus of this study, is a futuristic parameter, the LFC, the ratio of % area stenosis (%AS) to the square root of CDP at the throat region (CDPm), that combines both the anatomical and functional measurements. LFC has been referred to as a “futuristic” parameter because it requires integration of anatomical and functional measurements. This integration is currently under investigation and implementation in the industries, as further explained in the discussion below.
 LFC is a normalized parameter with a range from 0~1, similar to FFR. LFC has also been evaluated in vitro38-40,42 and in vivo34-37,43 for the successful assessment of the functional severity of epicardial stenosis. Furthermore, LFC has been shown to simultaneously distinguish the presence of epicardial stenosis with concomitant microvascular disease44 in an animal model.
Therefore, in this prospective clinical study, we have evaluated the diagnostic performance of LFC by correlating it with the existing parameters. Our hypothesis was that LFC would correlate better with existing endpoints when the anatomical and functional readings were combined. Accordingly, we correlated LFC with FFR, CFR, and hyperemic velocity (APVh), individually and then in combination with %AS. Similarly, we correlated LFC with HSR and HMR individually and in combination with %AS. The diagnostic applicability of LFC was further tested by comparing the LFC values before and after PCI. In addition, there has been a growing interest in vasodilator-free (basal) functional stenosis assessment, ie, parameters measured at baseline conditions.45-47 Therefore, we also assessed the LFC under basal conditions (LFCb) and performed additional analyses.
 Methods
The protocol for this study was approved by the Institutional Review Board (IRB) at the University of Cincinnati and the research and development (R&D) committee at the Cincinnati Veteran Affairs Medical Center (CVAMC).
 Patient population. Patients ≥18 years with an abnormal stress test indicating reversible ischemia were considered for enrollment into the study. Patients with bypass grafts, baseline serum creatinine >2.5 mg/dL, pregnancy, or significant comorbid conditions that incapacitated the patients from the consent process were excluded from the study.
Cardiac catheterization and functional measurements. Patients who consented to participate in the study underwent the standard-of-care cardiac catheterization. Unfractionated heparin was administered using a weight-based protocol. Using a 5 or 6 Fr diagnostic catheter, the left main (LM), left anterior descending (LAD), left circumflex (LCX), and right coronary artery (RCA) were visually assessed for blockages through coronary angiography. According to the standard of care, angiographically moderate to borderline severe lesions6,7 were further assessed using functional measurements at rest and at adenosine-induced maximal arterial dilatation (hyperemia). Patients with visually mild and severe stenoses were deemed a screen failure and were treated with either medical management or PCI, respectively, as per the standard of care.
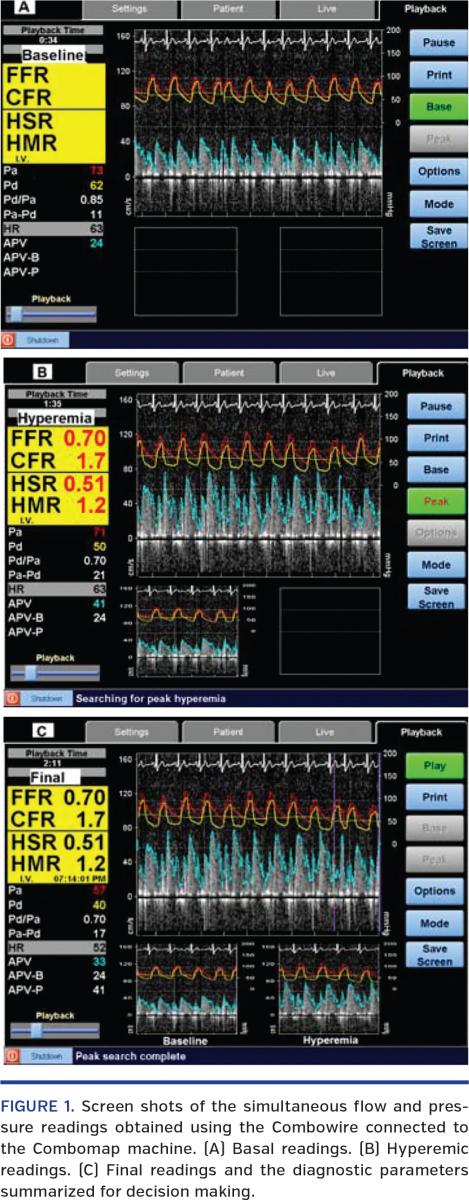
The aortic pressure (pa) and electrocardiographic (ECG) tracings were continuously recorded through the Combomap System (Volcano Therapeutics, Inc). Using a guide catheter, a 0.014˝ Combowire with a flow sensor at its tip and pressure sensor at 1.5 cm offset was advanced into the artery of interest. The pressure reading from the Combowire, while in the catheter, was equalized with pa before insertion into the artery. Next, the Combowire was advanced distal to the stenosis and placed at a location downstream to the stenosis and before any side branches. Baseline pressure and flow data were obtained using the Combomap machine (Figure 1A). Using intravenous adenosine 140 μg/kg/min as the stress-inducing agent, functional readings were obtained at hyperemia (Figure 1B). The parameters CFR, FFR, HSR, and HMR were obtained from the Combomap system (Figure 1C) based on the baseline and hyperemic readings.
Quantitative coronary angiography. The angiographic images taken during the procedure were reviewed. The frames representing the best view of the stenosed artery were selected.21 Most of the frames were autocalibrated and were ready for analysis. For those needing manual calibration, the size of the guide catheter was used as a reference. Lesion contour was carefully drawn to get the best possible measurements (Figure 2). Using automatic edge-detection techniques available in the GE centricity software, vessel diameter (Dv), stenosis diameter (Dm), and lesion length were obtained as shown in Figure 2. To check for consistency, QCA values were obtained from three different frames using blinded review. The %AS was calculated based on these diameter values. The averaged values were used for the analyses. For some stenoses, the stenosis parameters obtained from a single frame were used.

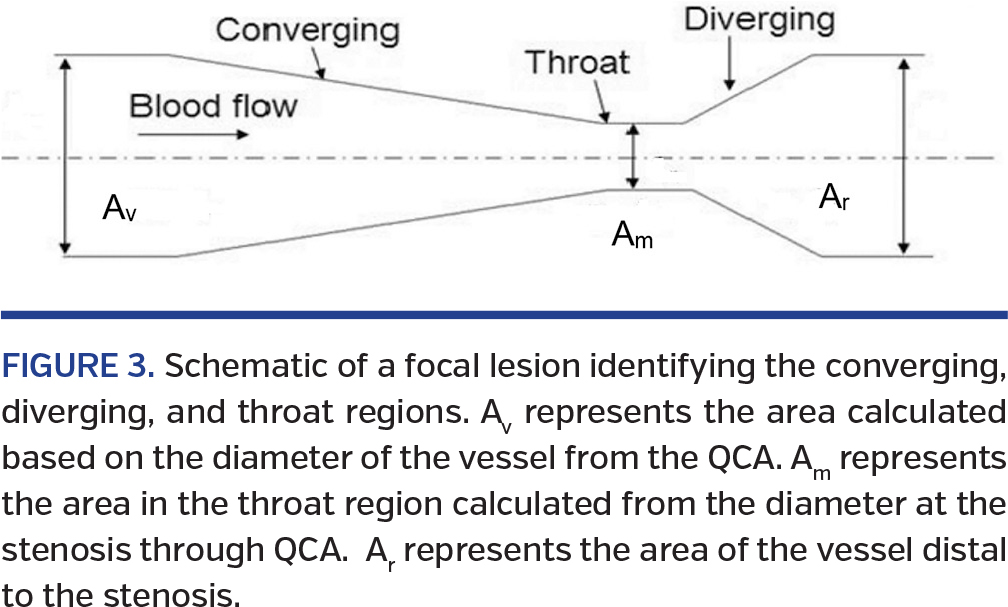
LFC calculation. As mentioned previously, LFC combines the lesion geometry (%AS, anatomical endpoint) and pressure and flow measurements (functional endpoints). LFC is defined as the ratio of the percent area obstruction to the square root of CDPm, which is the CDP calculated at the throat region of the stenosis (Figure 3):
In the above equation, the numerator 1-k is the %AS; in other words, k is the area ratio Am/Av, where Am and Av are area of the throat and vessel (Figures 2 and 3) obtained from QCA (cm2). On a similar note, the CDPm in the denominator is , where Δp is the pressure drop across the stenosis, pa (aortic pressure) – pd (downstream pressure measured from Combowire), ρ is the density of the blood (1.05 g/cm3), and APVm is the mean velocity in the throat region (Figure 3). The APVm is calculated from the measured distal APV (cm/sec). Ag is the area of the guidewire .
Furthermore, the APV value obtained using the Combowire is again corrected for the presence of guidewire to obtain the APVm using the formula (Am – Ag) APVm= (Avw) APV, where Avw is the area of the vessel calculated at the distal tip of the Combowire. All LFC and %AS values reported in this study include the area of obstruction caused by the guidewire.
Statistical analysis. Fifty-one datapoints were obtained from 49 patients. The LFC values obtained using the above-mentioned formula are first correlated with the pressure parameter (FFR), flow parameters (CFR and APVh), and anatomical data (%AS). Since LFC combines anatomical data (%AS) with pressure and flow data, it was correlated with FFR, CFR, and %AS in combination as well as FFR, APVh, and %AS in combination. Similarly, it was correlated individually with HSR and HMR, and in combination with %AS. Furthermore, a non-parametric Kruskal-Wallis ANOVA test was used to compare the mean values of the pre-PCI and post-PCI data in 5 vessels.
Similar comparisons were made between LFC measured at baseline conditions, LFCb, and the other basal parameters, FFRb, HSRb, and HMRb. For basal correlations, APVb was considered as the flow index instead of CFR. Forty-seven datapoints were used for the basal analysis. The number of points was reduced because the datapoints with negligible pressure gradient (Δp ~0) at baseline conditions were discarded. A P-value of <.05 was considered statistically significant for the correlations and analysis of variance (ANOVA) comparisons. All values were reported as mean ± standard error (SE).
Results
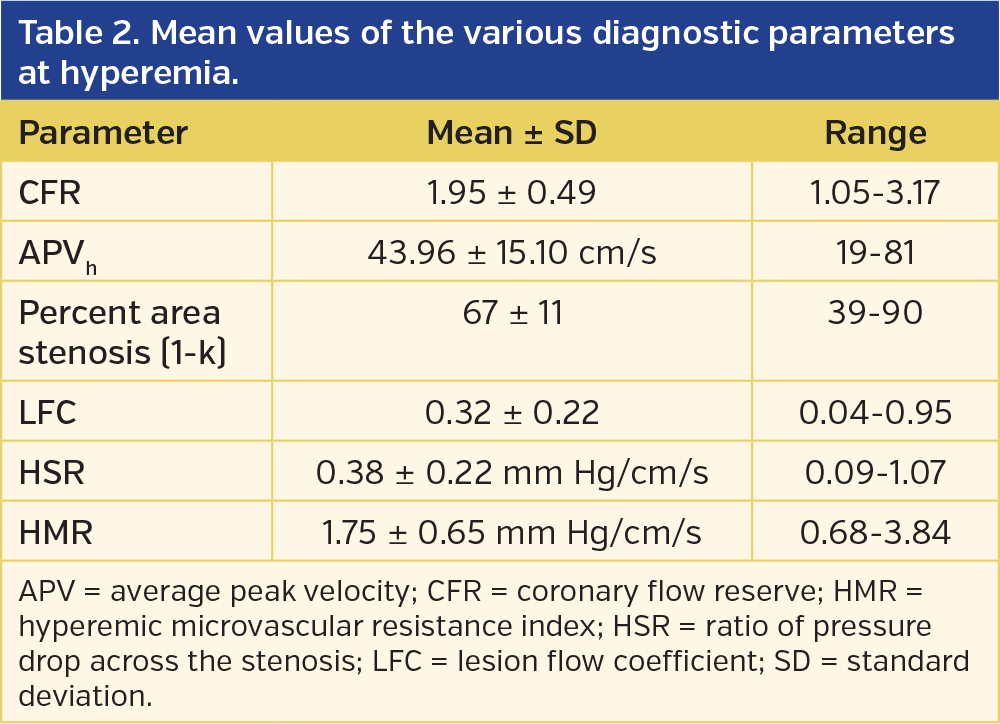
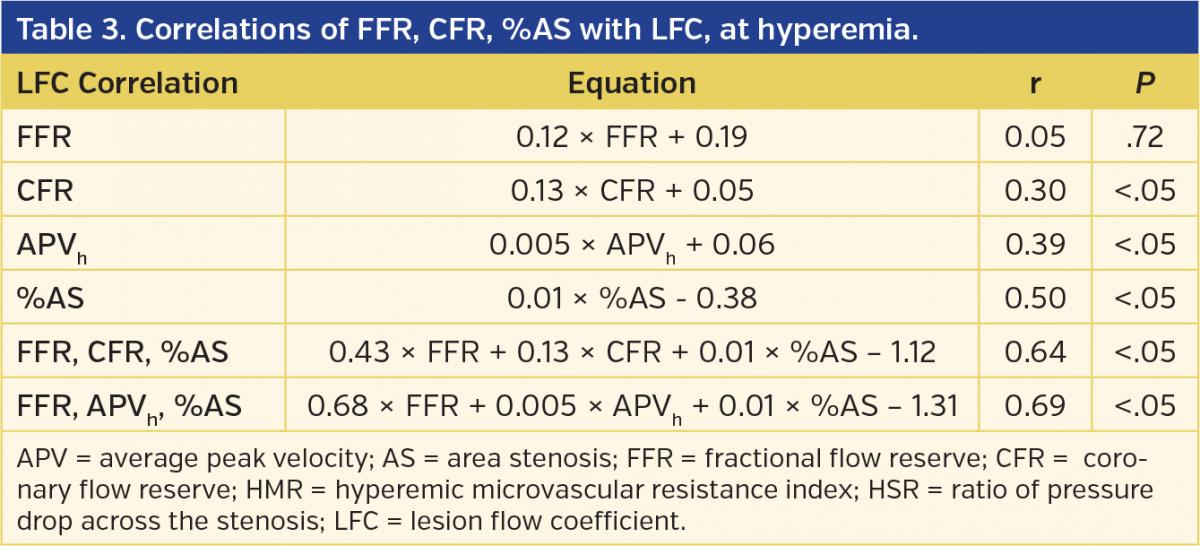
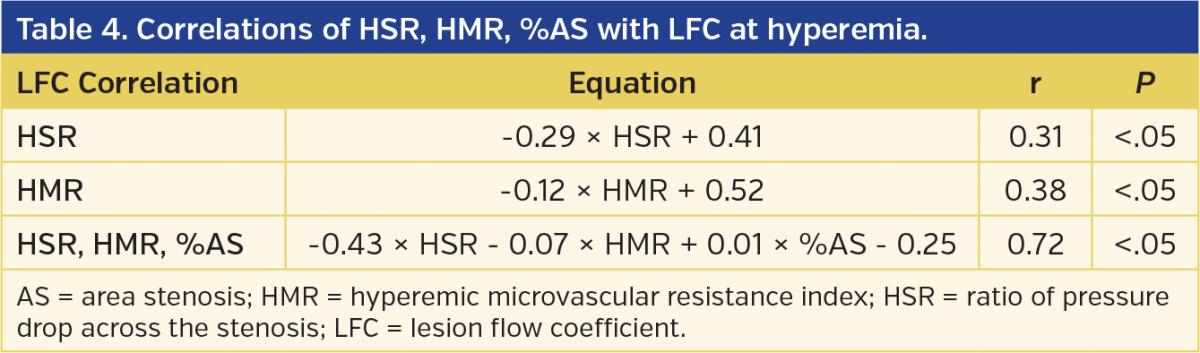
Patient history, demographics, targeted coronary arteries, the average and minimal luminal diameter and %AS of vessels for the 51 datapoints are presented in Table 1. Similarly, the mean values of the diagnostic parameters, CFR, FFR, APVh, %AS, LFC, HSR and HMR, along with their corresponding ranges are reported in Table 2. The correlation of hyperemic parameters, LFC with FFR, CFR, APVh, and %AS are reported in Table 3. The correlations with hyperemic HSR and HMR are presented in Table 4 and are discussed subsequently.
Hyperemic Parameters
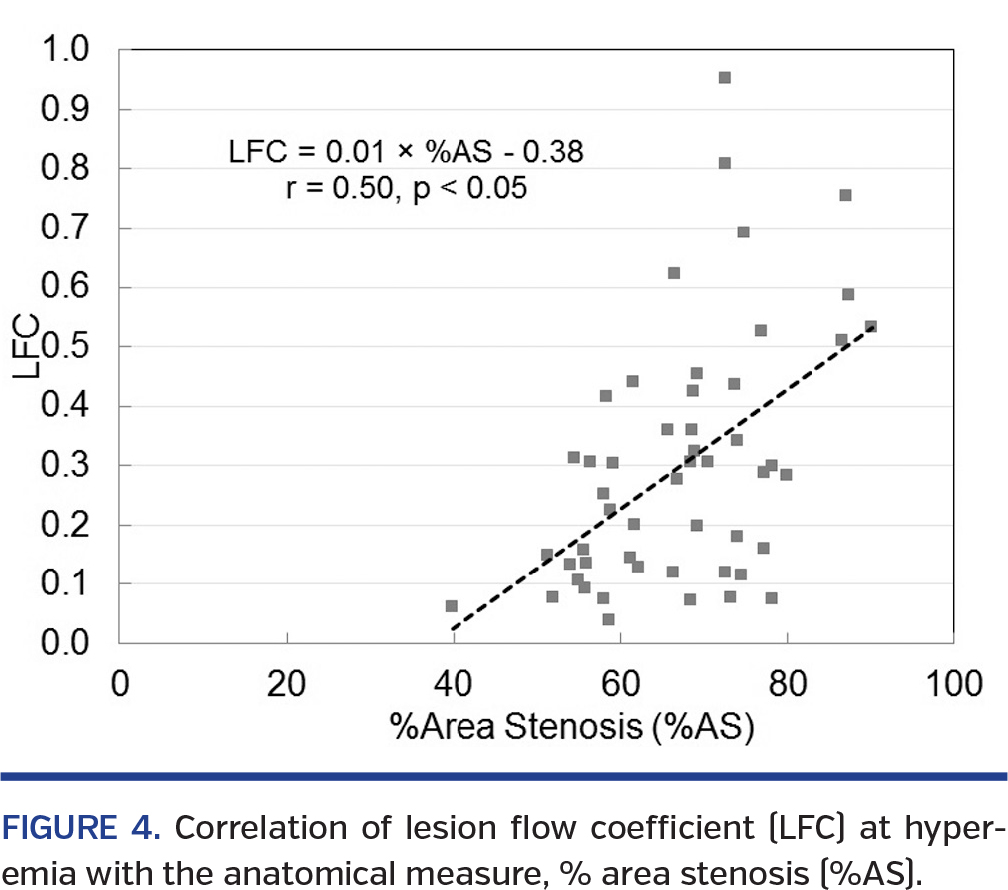
Correlation of hyperemic LFC with FFR, CFR, APVh, and %AS. The correlation equations along with regression coefficients (r-values) and the P-values obtained using the regression analysis of hyperemic LFC with FFR, CFR, APVh, and %AS are summarized in Table 3. Pressure-based FFR showed an insignificant (P=.72) linear correlation with LFC and the r-value was low (r = 0.05). When the LFC was correlated with the flow-based parameter CFR, the r-value significantly improved to 0.30 (P<.05). Similarly, LFC correlated significantly with hyperemic velocity, APVh (r = 0.39; P<.05). When LFC was correlated with the anatomical measure %AS, there was a significant correlation (P<.05) with an improved r–value of 0.50 (Figure 4).
More importantly, when LFC was correlated in combination with FFR, CFR, and %AS, the r-value significantly increased to 0.64 (P<.05). Similarly, LFC had a strong and significant correlation when FFR, APVh, and %AS were combined (r = 0.69; P<.05).
Correlation of hyperemic LFC with HSR, HMR, and %AS. The correlation equations, r-values and P-values of LFC with HSR and HMR are summarized in Table 4. There was a significant correlation between HSR and LFC with an r-value of 0.31 (P<.05). Similarly, there was a significant correlation between LFC and HMR, with an r-value of 0.38 (P<.05). Interestingly, when the LFC was correlated simultaneously with HSR, HMR, and %AS, the r-value considerably increased (r = 0.72) with a strong statistical significance (P<.05).
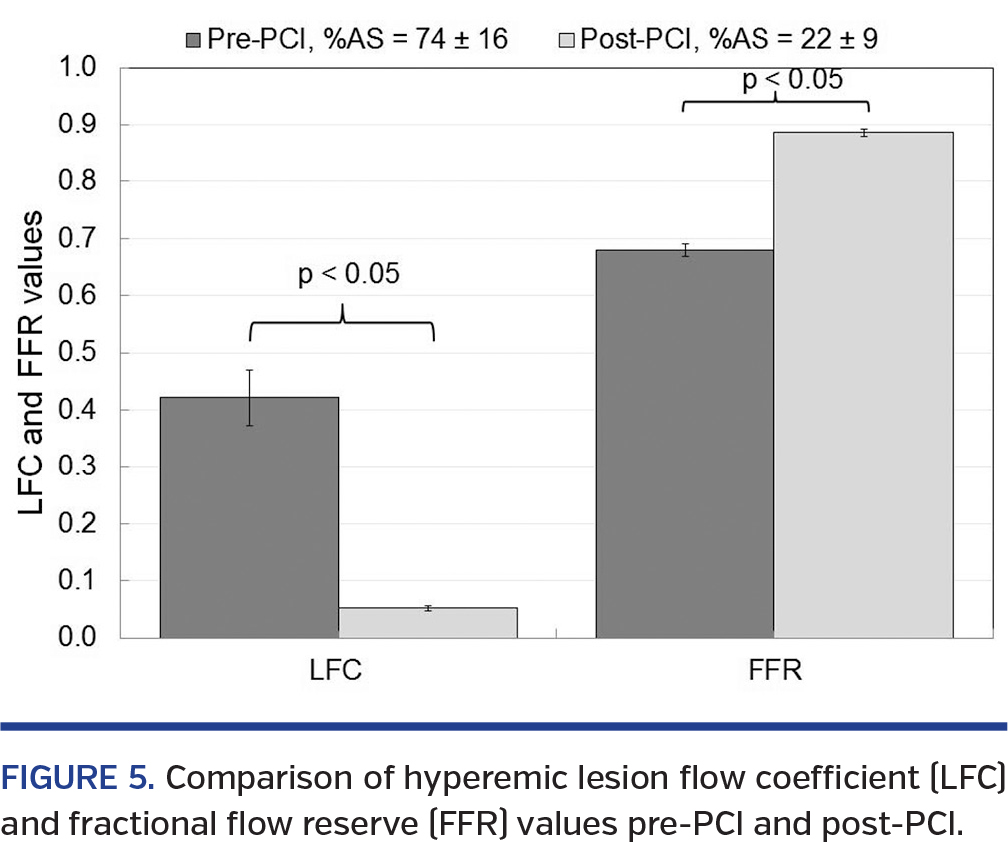
Hyperemic LFC variation pre-PCI and post-PCI. Based on the clinical indications for PCI of moderate lesions, we had a subset of 5 corresponding pre-PCI and post-PCI datapoints within the studied patient population. A comparison of mean FFR and LFC values between these two groups is presented in Figure 5. The mean values of %AS before PCI (74 ± 16%) and after PCI (22 ± 9%) were significantly different (P<.05). Correspondingly, the FFR values significantly increased from a pre-PCI value of 0.68 ± 0.01 to 0.88 ± 0.04 after PCI. The LFC value significantly decreased from 0.42 ± 0.05 before PCI to a value of 0.05 ± 0.004 after PCI. These values demonstrate a general trend of higher LFC values for a higher %AS and relatively decreased LFC values as the %AS decreases. Thus, the trend of LFC is opposite to FFR in relation to %AS. These initial data will be further augmented in the future using a larger sample size.
Basal Parameters
Correlations for basal LFC. The mean values of the basal parameters are summarized in Table 5. The correlation equations along with regression coefficients (r-values) and the P-values obtained using the regression analysis for the basal LFC (LFCb) with other basal parameters FFRb, APVb, and %AS are summarized in Table 6.
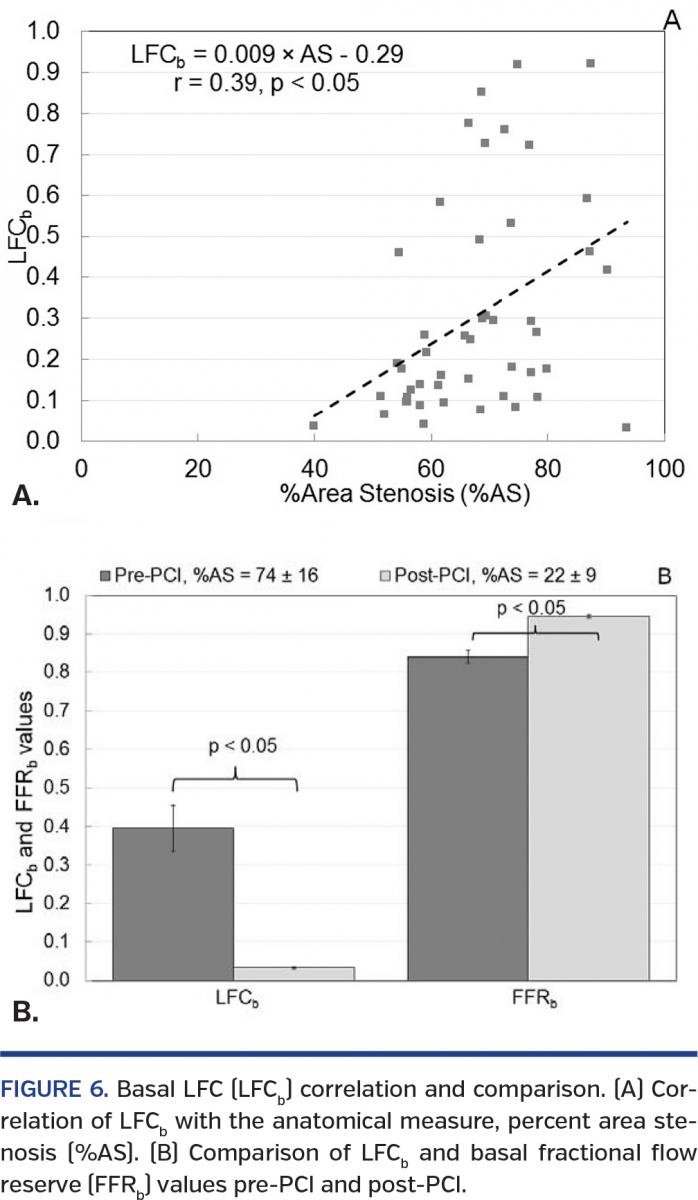
FFRb showed a significant linear correlation of LFCb with a r-value of 0.31 (P<.05). Similarly, LFCb showed a significant correlation with APVb (r = 0.33). Furthermore, %AS correlated significantly with LFCb and the r-value was 0.39 (P<.05) (Figure 6A). When LFCb was correlated simultaneously with FFRb, APVb, and %AS, the r-value significantly increased to 0.69 (P<.05).
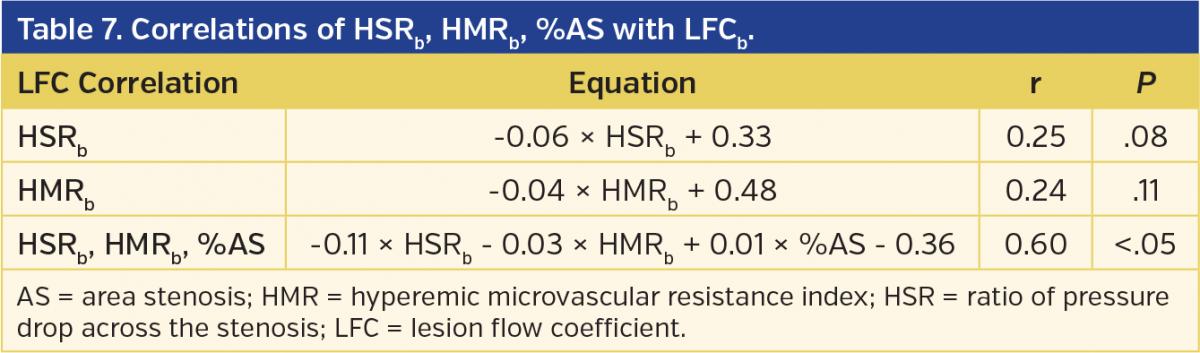
The correlation equations, r-values, and P-values of LFCb with HSRb and HMRb are summarized in Table 7. There was an insignificant correlation between HSRband LFCb (P>.05), while the r-value was 0.25. Similarly, there was an insignificant correlation between LFCb and HMRb(r = 0.24) (P>.05). When the LFCb was correlated in combination with HSRb, HMRb, and %AS, the r-value considerably increased with a higher statistical significance (r = 0.60; P<.05).
In addition to the correlations, pre-PCI and post-PCI comparisons for LFCb were also performed. These results are presented in Figure 6B. The mean LFCb value significantly decreased from 0.39 ± 0.06 to 0.03 ± 0.02 for the pre-PCI and post-PCI groups, respectively (P<.05). The mean FFRb values for the pre-PCI (0.84 ± 0.02) and post-PCI (0.94 ± 0.003) groups were also significantly different (P<.05). However, the percent decrease ([pre-PCI value – post-PCI value]/[pre-PCI value]) for LFCb was 92%, while the percent increase ([post-PCI value – pre-PCI value]/[post-PCI value])in FFRb was 10.6%. Thus, LFCb showed a wider variation between pre-PCI and post-PCI groups in comparison with FFRb. Furthermore, similar to LFC at hyperemia, LFCb also had an increasing trend with an increase in %AS.
Discussion
This is the first reported clinical study in which the parameter LFC, which combines the anatomical details (%AS) of the lesion with the functional measurements (pressure and flow), has been proposed and evaluated. We assessed the LFC in a clinical setting and correlated it with the existing parameters, FFR, CFR, HSR, HMR, and %AS. Furthermore, we tested this parameter to delineate pre-PCI and post-PCI groups. Similar analyses were performed between LFCb and other parameters under basal conditions (FFRb, HSRb, and HMRb).
Results in this clinical study showed that the proposed parameter, LFC, correlates significantly when the anatomical (%AS) and functional indices (pressure-based FFR and flow-based CFR or APVh) are combined. It also correlated well when the indices of HSR (defined for epicardial stenosis alone) and HMR (defined for microvascular resistance alone) were combined with the anatomical index, %AS, under hyperemia. Furthermore, LFC was able to distinguish the pre-PCI and post-PCI groups.
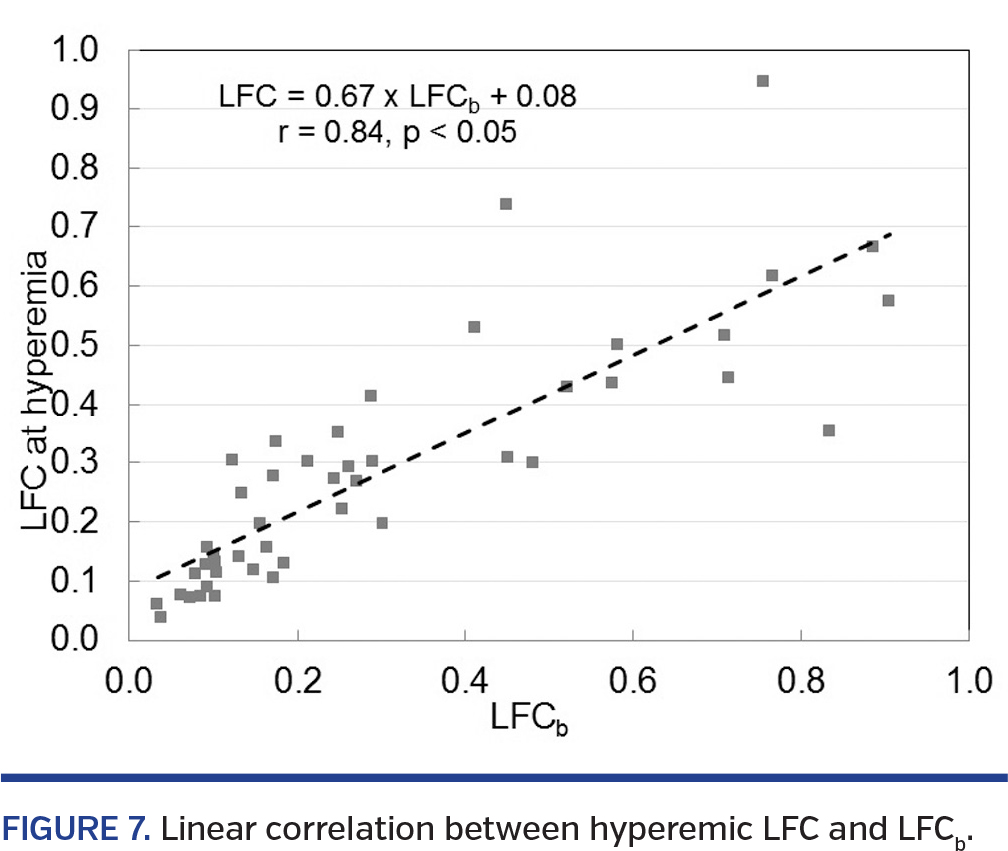
Due to the recent interest in vasodilator-free assessment of stenosis severity, we also assessed the LFC at baseline conditions. Present results showed that the LFCb, similar to the hyperemic LFC, showed significant correlations when FFRb, APVb, and %AS were combined and HSRb, HMRb, and %AS were combined. In addition, LFCb showed a wider variation in comparison to FFRb between the pre-PCI and post-PCI groups. Furthermore, the hyperemic LFC and LFCb had a strong linear correlation (Figure 7) (r = 0.84) that was statistically significant (P<.05). Thus, LFC depends less critically on the extent of hyperemia and can be applicable for vasodilator-free stenosis evaluation.
We have found an insignificant correlation between FFR and LFC. This can be explained by the fact that pressure-based FFR is an epicardial-specific parameter, while LFC combines functional (pressure and flow) and anatomical (%AS) measurements. In addition, more than one-half of our study population (30 out of 51) consisted of diabetic patients. The presence of diabetes is a strong predictor of concomitant microvascular disease. While LFC can account for the variations in flow due to the presence of concomitant microvascular disease, FFR (being a pressure-based parameter) tends to be overestimated in such scenarios.33 Therefore, the variability of FFR in the presence of microvascular disease might also be the reason for the lack of a significant correlation between LFC and FFR.
Multiple previous studies with small patient groups48,49 have reported insignificant correlations between FFR and CFR. However, a significant correlation between FFR and CFR has been reported in a larger sample size by Johnson et al in 2012.50 Based on this, we expect the strength and P-value of the correlation between the LFC and FFR to increase with the inclusion of a wider range of disease combinations with a larger sample size,50 mainly mild and severe stenoses, multiple serial stenoses, diffuse lesions, patients with coronary artery bypass grafts, and multivessel disease.
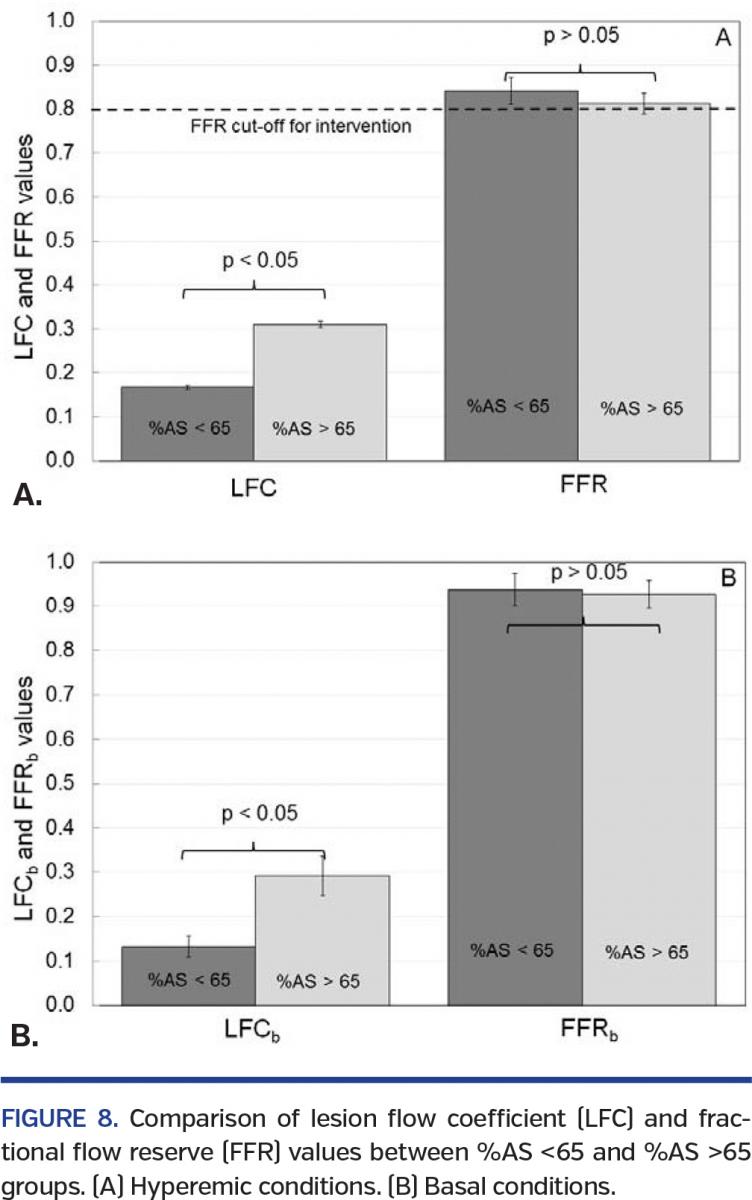
LFC corresponding to %AS cut-off. We also performed comparisons between hyperemic LFC and FFR values using a %AS cut-off of 65%. This was based on the reasoning that 65% area stenosis (or 40% diameter stenosis) was representative of the intermediate range of stenosis.51 The P-values were obtained using ANOVA analysis with SAS software. Similar comparisons were performed for the basal parameters LFCb and FFRb. Figure 8 summarizes the results of these comparisons. LFC values significantly increased from 0.17 ± 0.004 for the %AS <65% group to 0.31 ± 0.007 for the %AS >65% group (P<.05) (Figure 8A). Under baseline conditions, a similarly significant increase in LFCb values was observed (%AS <65%, 0.13 ± 0.02 and %AS >65%, 0.29 ± 0.05) (Figure 8B). On the other hand, the hyperemic FFR values decreased insignificantly (Figure 8A) from a value of 0.84 ± 0.03 for the %AS <65% group to a value of 0.81 ± 0.02 for the %AS >65% group (P>.05).52,53 Similarly, the FFRb values decreased insignificantly from a value of 0.94 ± 0.04 for the %AS <65% group to a value of 0.93 ± 0.03 for the %AS >65% group (P>.05) (Figure 8B). Therefore, LFC was able to distinguish the tested %AS groups under both hyperemic and basal conditions, whereas the FFR was unable to distinguish between the tested %AS groups.
Presence of guidewire. One of the unique features of LFC is that it can account for the presence of a guidewire. All functional measurements are obtained by a guidewire inserted across the stenosis, and thus, the presence of a guidewire adds to the severity of the blockage. Using the present dataset, a comparison was made between the %AS and LFC values with and without guidewire. The average %AS without the guidewire correction (66 ± 1%) wasn’t significantly different in the presence of a guidewire (67 ± 1%; P>.05). Similarly, without the guidewire correction, the LFC value was 0.32 ± 0.03, which remained insignificantly different when compared with the value in the presence of a guidewire (0.31 ± 0.03; P>.05). A significant linear correlation (r = 0.99) between LFC values with and without guidewire was observed (P<.05). Therefore, the presence of the smaller diameter guidewire (0.014˝ = 0.3556 mm) didn’t cause a significant difference in the LFC values.
Clinical diagnosis using LFC. An explanation of the theoretical basis of LFC is provided in Appendix 1 (available online at www.invasivecardiology.com). The behavior of LFC under the three combinations of CAD disease found in a clinical scenario is explained below.
Epicardial disease alone: Theoretically, as the %AS increases, the APVm and Δp also increase. However, the %AS and APVm outweigh the contribution of Δp, resulting in an increase in the LFC values as the %AS increases. In line with this, in the current study, we observed an increasing trend in the LFC, under both hyperemia and basal conditions, as the %AS increased (Figures 4 and 6A). As the value of %AS approaches a very high value, the LFC asymptotically tends toward unity.
Microvascular disease alone: Most of the microvascular diseases are characterized by reduced flow at hyperemia.4,5,54 For a fixed %AS, due to suboptimal arterial dilatation at hyperemia, there will be a decrease in both the APV and Δp. For the LFC calculation, the contribution of the decrease in APV is predominant over the (Δp)1/2. This leads to a decrease in LFC value as the microvascular disease increases in severity. Therefore, in the absence of epicardial stenosis, lower LFC values are indicative of abnormal microcirculation and increased LFC values are indicative of normal microcirculation.
Combination of epicardial and microvascular disease: When epicardial and microvascular diseases are found in combination, for a fixed stenosis, the LFC value decreases in the presence of microvascular disease. For a fixed microvascular status, the LFC value increases as the epicardial disease severity increases. Such a trend was discussed in a previous preclinical study.43 However, predictions about the concomitant diseases cannot be made for the present clinical study due to the limited dataset.
Therefore, LFC can have separate cut-off values to indicate the severity of epicardial stenosis alone, microvascular disease alone, and concomitant epicardial stenosis with microvascular disease. Using a single index, such as LFC, a cardiologist may obtain comprehensive knowledge about the relative contribution of each of the epicardial and microvascular resistances. This will allow better therapeutic decision making. In order to obtain diagnostic cut-off for the different scenarios explained above, additional analyses need to be carried out with a larger patient dataset before application in catheterization laboratory.
Clinical calculation of LFC. From the definition of LFC, it is evident that the numerator %AS is obtained from imaging methods. The denominator CDPm is obtained through functional measurements.
The current technologies available to evaluate %AS are QCA, IVUS, and OCT. QCA does not require any additional time or procedure and can be obtained using the angiograms. This is the method used in our study. On the other hand, IVUS and OCT may provide more accurate area measurement, but they require the insertion of an additional catheter, adding time and expense to the standard-of-care procedure. However, the importance of IVUS and OCT for accurate anatomical measurements is gaining popularity for both stenosis assessment and stent placement.55-57 The introduction of the 0.014˝ dual-sensor tipped Combowire, which has flow and pressure sensors at the tip, has made it easier to obtain both pressure and flow readings with a single wire. Therefore, the ease of application of the LFC is evident from the fact that it can be computed using the data obtained from a 0.014˝ guidewire and QCA evaluation of standard angiographic images. Neither Combowire measurements nor QCA analysis adds any extra time to the standard-of-care measurements.
Furthermore, the new s5 imaging system (Volcano Corporation) is the first step toward the integration of anatomical measurements (using IVUS) and functional measurements (currently, FFR) in the catheterization laboratory. It is expected that such integration will further improve the use of combined functional and anatomical assessment in the cardiac catheterization lab. Moreover, in this study, we have also shown that LFCb can be a potential clinical parameter. Therefore, LFC is a potential parameter for clinical application because of: (1) its ease of application in a catheterization lab; and (2) the ability to delineate epicardial and microvascular disease.
Limitations
APV. It has been proven that acquiring the velocity values is more feasible and accurate in the coronary arteries as opposed to flow readings.58 LFC, developed from fundamental fluid dynamics principles, has been defined based on the average velocity rather than APV. However, APV is the value that we obtain using a Combowire. For a flow waveform, the APV or peak velocity is always higher than the average velocity. Therefore, the LFC values might be somewhat higher when the APV is used instead of average velocity. In other words, LFC values would be somewhat lower if computed using the average velocity. The current technology allows the acquisition of APV only. It is expected that the trend of LFC is not affected by the measurement of APV as opposed to the average velocities.
QCA. QCA is limited by the fact that a 3D vessel is being analyzed in a 2D plane. There might be some inaccuracies in the LFC values due to the 2D area measurements. We performed blinded QCA measurements to reduce observer bias and used multiple frames to obtain average diameter and area. The technology to achieve better anatomical details is emerging rapidly, mainly by using either IVUS or OCT techniques. The main roadblock for these emerging technologies is that they are not yet cost effective or time effective. Therefore, using the standard-of-care technology available in the catheterization laboratory, we presented the best possible LFC values. The LFC calculation can further improve with advancements in the technology.
Variations of CAD. This parameter needs to be further tested in patient subgroups for application to left main disease, complex and diffuse lesions, and particularly in patients with known microvascular disease.
Future Directions
LFC still needs to be tested in a larger patient population in order to obtain cut-off values for delineating epicardial and microvascular diseases. This can be achieved by performing ROC analysis using the existing indices for epicardial and microvascular disease. For assessing severity of epicardial stenosis using LFC, existing FFR cut-off values of 0.75 and 0.80 can be used. Similarly, for microvascular disease, normal FFR values (FFR >0.75 or FFR >0.80) and the abnormal value of CFR <2 can be used. In addition, strong clinical predictors for microvascular disease like presence of diabetes can be used to identify microvascular disease. The future plan is to perform a meta-analysis based on previous literature in order to obtain diagnostic cut-offs for the LFC. To obtain better anatomical measurements for more accurate LFC values, clinical trials using IVUS and/or OCT will also be planned. Furthermore, we plan to conduct a prospective clinical trial specifically designed to evaluate the positive and negative predictive ability of LFC relative to positron emission tomography (PET) scan. We chose PET scan because: (1) the non-invasive PET-CFR can be used instead of invasive CFR obtained during catheterization; and (2) the PET scan can be used as an imaging modality in place of SPECT imaging. Consequently, these two advantages can reduce procedure time and cost while simplifying the diagnostic protocol for assessing CAD, thus benefiting both the patients and clinicians.
Conclusion
LFC, a futuristic parameter that combines both anatomical and functional readings, correlated significantly when FFR, CFR or APVh, and %AS were combined, as well as when HSR, HMR, and %AS were combined. LFC showed an increasing trend as the %AS increased and was able to delineate between pre-PCI and post-PCI groups, under both hyperemia and baseline conditions. Furthermore, LFCb showed a wider variability between the pre-PCI and post-PCI groups in comparison with FFRb. With the advent of accurate modalities such as OCT and IVUS, there is an increasing interest in obtaining the anatomical details of lesions using imaging techniques. Therefore, we believe that LFC, which combines both the anatomical and functional details of a stenosis, would allow the comprehensive diagnosis of CAD.
Acknowledgments. The authors would like to thank Gary Henry, Sherri Rosser, and Mary Colleen Rogge at the VA; Ginger Conway, Rachel Mardis, Cindy Werner, and Cindy Mulcahy at the UCMC for help with the patient consent process. We would also like to thank all the nurses and technicians at the VA and UCMC catheterization laboratories for their help during the procedures.
References
- Heidenreich PA, Trogdon JG, Khavjou OA, et al. Forecasting the future of cardiovascular disease in the United States: a policy statement from the American Heart Association. Circulation. 2011;123(8):933-944.
- Roger VL, Go AS, Lloyd-Jones DM, et al. Executive summary: heart disease and stroke statistics – 2012 update: a report from the American Heart Association. Circulation. 2012;125(1):188-197.
- Camici PG, Crea F. Coronary microvascular dysfunction. N Engl J Med. 2007;356(8):830-840.
- Patel B, Fisher M. Therapeutic advances in myocardial microvascular resistance: unravelling the enigma. Pharmacol Ther. 2010;127(2):131-147.
- Pries AR, Habazettl H, Ambrosio G, et al. A review of methods for assessment of coronary microvascular disease in both clinical and experimental settings. Cardiovasc Res. 2008;80(2):165-174.
- Levine GN, Bates ER, Blankenship JC, et al. 2011 ACCF/AHA/SCAI guideline for percutaneous coronary intervention: a report of the American College of Cardiology Foundation/American Heart Association Task Force on Practice Guidelines and the Society for Cardiovascular Angiography and Interventions. Circulation. 2011;124(23):e574-651.
- Levine GN, Bates ER, Blankenship JC, et al. 2011 ACCF/AHA/SCAI guideline for percutaneous coronary intervention: executive summary: a report of the American College of Cardiology Foundation/American Heart Association Task Force on Practice Guidelines and the Society for Cardiovascular Angiography and Interventions. Circulation. 2011;124(23):2574-2609.
- Pijls NH, Fearon WF, Tonino PA, et al. Fractional flow reserve versus angiography for guiding percutaneous coronary intervention in patients with multivessel coronary artery disease: 2-year follow-up of the FAME (Fractional Flow Reserve Versus Angiography for Multivessel Evaluation) study. J Am Coll Cardiol. 2010;56(3):177-184.
- Pijls NH, van Son JA, Kirkeeide RL, De Bruyne B, Gould KL. Experimental basis of determining maximum coronary, myocardial, and collateral blood flow by pressure measurements for assessing functional stenosis severity before and after percutaneous transluminal coronary angioplasty. Circulation. 1993;87(4):1354-1367.
- Tonino PA, Fearon WF, De Bruyne B, et al. Angiographic versus functional severity of coronary artery stenoses in the FAME study fractional flow reserve versus angiography in multivessel evaluation. J Am Coll Cardiol. 2010;55(25):2816-2821.
- Gould KL, Lipscomb K. Effects of coronary stenoses on coronary flow reserve and resistance. Am J Cardiol. 1974;34(1):48-55.
- Gould KL, Lipscomb K, Hamilton GW. Physiologic basis for assessing critical coronary stenosis. Instantaneous flow response and regional distribution during coronary hyperemia as measures of coronary flow reserve. Am J Cardiol. 1974;33(1):87-94.
- Emanuelsson H, Dohnal M, Lamm C, Tenerz L. Initial experiences with a miniaturized pressure transducer during coronary angioplasty. Cathet Cardiovasc Diagn. 1991;24(2):137-143.
- Doucette JW, Corl PD, Payne HM, et al. Validation of a Doppler guide wire for intravascular measurement of coronary artery flow velocity. Circulation. 1992;85(5):1899-1911.
- Siebes M, Verhoeff BJ, Meuwissen M, de Winter RJ, Spaan JA, Piek JJ. Single-wire pressure and flow velocity measurement to quantify coronary stenosis hemodynamics and effects of percutaneous interventions. Circulation. 2004;109(6):756-762.
- Meuwissen M, Siebes M, Chamuleau SA, et al. Hyperemic stenosis resistance index for evaluation of functional coronary lesion severity. Circulation. 2002;106(4):441-446.
- Verhoeff BJ, Siebes M, Meuwissen M, et al. Influence of percutaneous coronary intervention on coronary microvascular resistance index. Circulation. 2005;111(1):76-82.
- Fearon WF, Balsam LB, Farouque HM, et al. Novel index for invasively assessing the coronary microcirculation. Circulation. 2003;107(25):3129-3132.
- Bartunek J, Sys SU, Heyndrickx GR, Pijls NH, De Bruyne B. Quantitative coronary angiography in predicting functional significance of stenoses in an unselected patient cohort. J Am Coll Cardiol. 1995;26(2):328-334.
- Fischer JJ, Samady H, McPherson JA, et al. Comparison between visual assessment and quantitative angiography versus fractional flow reserve for native coronary narrowings of moderate severity. Am J Cardiol. 2002;90(3):210-215.
- Sirnes PA, Myreng Y, Molstad P, Golf S. Reproducibility of quantitative coronary analysis: assessment of variability due to frame selection, different observers, and different cinefilmless laboratories. Int J Card Imaging. 1996;12(3):197-203.
- Nallamothu BK, Spertus JA, Lansky AJ, et al. Comparison of clinical interpretation with visual assessment and quantitative coronary angiography in patients undergoing percutaneous coronary intervention in contemporary practice: the Assessing Angiography (A2) project. Circulation. 2013;127(17):1793-1800.
- Ahn JM, Kang SJ, Mintz GS, et al. Validation of minimal luminal area measured by intravascular ultrasound for assessment of functionally significant coronary stenosis comparison with myocardial perfusion imaging. JACC Cardiovasc Interv. 2011;4(6):665-671.
- Kang SJ, Lee JY, Ahn JM, et al. Validation of intravascular ultrasound-derived parameters with fractional flow reserve for assessment of coronary stenosis severity. Circ Cardiovasc Interv. 2011;4(1):65-71.
- Barlis P, Di Mario C, van Beusekom H, Gonzalo N, Regar E. Novelties in cardiac imaging — optical coherence tomography (OCT). EuroIntervention. 2008;4(Suppl C):C22-C26.
- Jang IK, Bouma BE, Kang DH, et al. Visualization of coronary atherosclerotic plaques in patients using optical coherence tomography: comparison with intravascular ultrasound. J Am Coll Cardiol. 2002;39(4):604-609.
- Radu MD, Falk E. In search of vulnerable features of coronary plaques with optical coherence tomography: is it time to rethink the current methodological concepts? Eur Heart J. 2012;33(1):9-12.
- Raffel OC, Akasaka T, Jang IK. Cardiac optical coherence tomography. Heart. 2008;94(9):1200-1210.
- Yabushita H, Bouma BE, Houser SL, et al. Characterization of human atherosclerosis by optical coherence tomography. Circulation. 2002;106(13):1640-1645.
- Fearon WF, Aarnoudse W, Pijls NH, et al. Microvascular resistance is not influenced by epicardial coronary artery stenosis severity: experimental validation. Circulation. 2004;109(19):2269-2272.
- Marzilli M, Sambuceti G, Fedele S, L’Abbate A. Coronary microcirculatory vasoconstriction during ischemia in patients with unstable angina. J Am Coll Cardiol. 2000;35(2):327-334.
- Yeung AC. Simultaneous evaluation of epicardial and microvascular function in human beings: a technical tour de force. J Heart Lung Transplant. 1998;17(5):495-496.
- Kern MJ, Lerman A, Bech JW, et al. Physiological assessment of coronary artery disease in the cardiac catheterization laboratory: a scientific statement from the American Heart Association Committee on Diagnostic and Interventional Cardiac Catheterization, Council on Clinical Cardiology. Circulation. 2006;114(12):1321-1341.
- Kolli KK, Banerjee RK, Peelukhana SV, et al. Effect of changes in contractility on pressure drop coefficient and fractional flow reserve in a porcine model. J Invasive Cardiol. 2012;24(1):6-12.
- Kolli KK, Banerjee RK, Peelukhana SV, et al. Influence of heart rate on fractional flow reserve, pressure drop coefficient, and lesion flow coefficient for epicardial coronary stenosis in a porcine model. Am J Physiol Heart Circ Physiol. 2011;300(1):H382-H387.
- Peelukhana SV, Banerjee RK, Kolli KK, et al. Effect of heart rate on hemodynamic endpoints under concomitant microvascular disease in a porcine model. Am J Physiol Heart Circ Physiol. 2012;302(8):H1563-H1573.
- Peelukhana SV, Kolli KK, Leesar MA, et al. Effect of myocardial contractility on hemodynamic end points under concomitant microvascular disease in a porcine model. Heart Vessels. 2013.
- Banerjee RK, Ashtekar KD, Helmy TA, Effat MA, Back LH, Khoury SF. Hemodynamic diagnostics of epicardial coronary stenoses: in-vitro experimental and computational study. Biomedical Engineering Online. 2008;7:24.
- Banerjee RK, Back LH, Back MR, Cho YI. Physiological flow analysis in significant human coronary artery stenoses. Biorheology. 2003;40(4):451-476.
- Banerjee RK, Sinha Roy A, Back LH, Back MR, Khoury SF, Millard RW. Characterizing momentum change and viscous loss of a hemodynamic endpoint in assessment of coronary lesions. J Biomechanics. 2007;40(3):652-662.
- Kolli KK, Helmy TA, Peelukhana SV, et al. Functional diagnosis of coronary stenoses using pressure drop coefficient: a pilot study in humans. Catheter Cardiovasc Interv. 2014;83(3):377-385. Epub 2013 Aug 1.
- Banerjee RK, Back LH, Back MR, Cho YI. Catheter obstruction effect on pulsatile flow rate — pressure drop during coronary angioplasty. J Biomech Eng. 1999;121(3):281-289.
- Sinha Roy A, Back MR, Khoury SF, et al. Functional and anatomical diagnosis of coronary artery stenoses. J Surg Res. 2008;150(1):24-33.
- Banerjee RK, Ashtekar KD, Effat MA, et al. Concurrent assessment of epicardial coronary artery stenosis and microvascular dysfunction using diagnostic endpoints derived from fundamental fluid dynamics principles. J Invasive Cardiol. 2009;21(10):511-517.
- Sen S, Escaned J, Malik IS, et al. Development and validation of a new adenosine-independent index of stenosis severity from coronary wave-intensity analysis: results of the ADVISE (ADenosine Vasodilator Independent Stenosis Evaluation) study. J Am Coll Cardiol. 2012;59(15):1392-1402.
- van de Hoef TP, Nolte F, Damman P, et al. Diagnostic accuracy of combined intracoronary pressure and flow velocity information during baseline conditions: adenosine-free assessment of functional coronary lesion severity. Circ Cardiovasc Interv. 2012;5(4):508-514.
- Mamas MA, Horner S, Welch E, et al. Resting Pd/Pa measured with intracoronary pressure wire strongly predicts fractional flow reserve. J Invasive Cardiol. 2010;22(6):260-265.
- Baumgart D, Haude M, Goerge G, et al. Improved assessment of coronary stenosis severity using the relative flow velocity reserve. Circulation. 1998;98(1):40-46.
- Werner GS, Ferrari M, Richartz BM, Gastmann O, Figulla HR. Microvascular dysfunction in chronic total coronary occlusions. Circulation. 2001;104(10):1129-1134.
- Johnson NP, Kirkeeide RL, Gould KL. Is discordance of coronary flow reserve and fractional flow reserve due to methodology or clinically relevant coronary pathophysiology? JACC Cardiovasc Imaging. 2012;5(2):193-202.
- Tobis J, Azarbal B, Slavin L. Assessment of intermediate severity coronary lesions in the catheterization laboratory. J Am Coll Cardiol. 2007;49(8):839-848.
- Ben-Dor I, Torguson R, Deksissa T, et al. Intravascular ultrasound lumen area parameters for assessment of physiological ischemia by fractional flow reserve in intermediate coronary artery stenosis. Cardiovasc Revasc Med. 2012;13(3):177-182.
- Briguori C, Anzuini A, Airoldi F, et al. Intravascular ultrasound criteria for the assessment of the functional significance of intermediate coronary artery stenoses and comparison with fractional flow reserve. Am J Cardiol. 2001;87(2):136-141.
- Marzilli M. Coronary microcirculation: the new frontier in coronary artery disease. Heart Metabolism. 2008;38:23-25.
- Kusama I, Hibi K, Kosuge M, et al. Intravascular ultrasound assessment of the association between spatial orientation of ruptured coronary plaques and remodeling morphology of culprit plaques in ST-elevation acute myocardial infarction. Heart Vessels. 2012;27(6):541-547.
- Sakata K, Kawashiri MA, Ino H, et al. Intravascular ultrasound appearance of scattered necrotic core as an index for deterioration of coronary flow during intervention in acute coronary syndrome. Heart Vessels. 2012;27(5):443-452.
- Tanaka N, Pijls NH, Koolen JJ, et al. Assessment of optimum stent deployment by stent boost imaging: comparison with intravascular ultrasound. Heart Vessels. 2013;28(1):1-6.
- Segal J, Kern MJ, Scott NA, et al. Alterations of phasic coronary artery flow velocity in humans during percutaneous coronary angioplasty. J Am Coll Cardiol. 1992;20(2):276-286.
- Bache RJ, Schwartz JS. Effect of perfusion pressure distal to a coronary stenosis on transmural myocardial blood flow. Circulation. 1982;65(5):928-935.
- Gould KL. Pressure-flow characteristics of coronary stenoses in unsedated dogs at rest and during coronary vasodilation. Circ Res. 1978;43(2):242-253.
- Gould KL, Kelley KO, Bolson EL. Experimental validation of quantitative coronary arteriography for determining pressure-flow characteristics of coronary stenosis. Circulation. 1982;66(5):930-937.
- Young DF, Cholvin NR, Kirkeeide RL, Roth AC. Hemodynamics of arterial stenoses at elevated flow rates. Circ Res. 1977;41(1):99-107.
- Young DF, Tsai FY. Flow characteristics in models of arterial stenoses. II. Unsteady flow. J Biomech. 1973;6(5):547-55
________________________________________________________________________________
From the 1Department of Mechanical and Materials Engineering; 2Division of Cardiovascular Diseases, University of Cincinnati, Cincinnati, Ohio; 3Veteran Affairs Medical Center, Cincinnati, Ohio; 4University of Alabama, Birmingham, Alabama; and 5Jet Propulsion Laboratory, Pasadena, California.
Funding: This work is funded by the VA Merit Review Grant (I01CX000342-01), Department of Veteran Affairs.
Disclosure: The authors have completed and returned the ICMJE Form for Disclosure of Potential Conflicts of Interest. The authors report no conflicts of interest regarding the content herein.
Manuscript submitted February 14, 2014, provisional acceptance given April 3, 2014, final version accepted April 9, 2014.
Address for correspondence: Prof. Rupak K. Banerjee, PhD, PE, University of Cincinnati, Mechanical Engineering, 598 Rhodes Hall, University of Cincinnati, Cincinnati, OH 45221. Email: rupak.banerjee@uc.edu


