


Cost Effectiveness of Fish Skin Grafts Versus Standard of Care on Wound Healing of Chronic Diabetic Foot Ulcers: A Retrospective Comparative Cohort Study
Abstract
Introduction. Health care policy decision makers seek the highest quality products at the lowest cost for their patients. Cost-benefit analysis is a helpful tool and can be used together with other sources of information to ensure the most efficient use of medical resources. Objective. The objective of this retrospective comparative cohort study is to evaluate the cost effectiveness of fish skin therapy compared with standard of care (SOC) on chronic diabetic foot ulcers (DFUs). Methods. Retrospective patient data collected in a single wound care setting from 2014 to 2017 were included. In total, 59 DFUs treated with fish skin were used to calculate transition probabilities for a Markov model in which a hypothetical patient cohort treated with fish skin was compared with an identical hypothetical patient cohort treated with SOC. Cost was from the perspective of the payer, and the time horizon was set at 1 year. Results. The model indicated that fish skin treatment could result in lower costs ($11 210 vs. $15 075 per wound), more wounds healing (83.2% vs. 63.4%), fewer amputations (4.6% vs. 6.9%), and a higher quality of life (0.676 vs. 0.605 quality-adjusted life year [QALY]) than the SOC. A probabilistic sensitivity analysis, based on a Monte Carlo simulation, indicated that the fish skin treatment (on DFUs) would be 93.6% likely to be cost effective for a willingness to pay at $100000 per QALY and 71.4% likely to be cheaper than SOC. Conclusions. Including fish skin grafts in the SOC for DFU treatment has the potential to reduce costs while improving patient outcomes.
Introduction
Diabetes mellitus (DM) has become a worldwide epidemic, affecting more than 400 million people as of 2014; with a prevalence of 8.5% in the world’s adult population, which was up from 4.7% in 1980; these numbers are expected to continue to increase.1,2 Patients with diabetes and neuropathy are at risk of developing diabetic foot ulcers (DFUs), which are chronic ulcers resulting from a localized injury to the foot. Found most often in patients with foot deformity, neuropathy, and/or insufficient blood flow, patients with DM have an estimated lifetime risk of developing a DFU to be about 15% to 25%.3-5 Patients with DFUs face an increased risk of infection, amputation, and death, with a 5-year mortality rate of 45%.6 Roughly 40% of patients with a DFU go on to have a DFU-related amputation, and within 5 years of amputation, 70% of individuals with a DFU-related amputation will die.5,7,8
The standard of care (SOC) treatment for DFUs consists of debridement, controlling and preventing infections, addressing ischemia, dressing the wound to maintain a moist wound environment, and offloading practices.9 Ideally, offloading should utilize total contact casting (TCC), although only 2% to 5% of patients in the United States receive a TCC.10,11 Offloading more commonly entails removable walking boots and other special footwear, crutches, and/or a wheelchair.10,11 This combined treatment was described in a consensus statement from the American Diabetes Association,9 and although the more commonly used methods of offloading may be suboptimal, it is often the standard in clinical trials and the type of care most patients receive in the community. While this therapy is relatively inexpensive, it is estimated that only 50% of all DFUs heal within 1 year in the United States, and the longer the wound persists, the greater the chance of critical complications, which are difficult and costly to treat.12,13 Hence, DFUs place a substantial burden on both private and public payers and often reduce quality of life (QoL) in this patient population. Promoting and accelerating DFU healing can result in the avoidance of amputations, resulting in better patient QoL as well as reducing overall hospitalization rates, contributing to overall cost savings, and potentially supporting higher initial spending.
Alternatives when SOC fails
There are many advanced tissue strategies available to treat DFUs that should be considered if 50% wound size reduction is not achieved within 4 weeks of SOC.14,15 However, the costs of these advanced treatments are usually higher, and they often have unproven or unclear clinical benefits.16–18 Among these treatments are various allografts and xenografts, ranging from minimally manipulated to heavily processed, as well as bioengineered acellular or cellular grafts.
Characteristics of fish skin grafts
Fish skin grafts are made from the skin of North Atlantic cod. The product, Omega3 Wound (Kerecis), is cleared by the US Food and Drug Administration as an unclassified collagen wound dressing (under the product code KGN).19 As opposed to mammalian-derived products, no disease transmission risk exists from North Atlantic cod to humans; as a result, the fish skin can be lyophilized, decellularized, and sterilized in a comparatively gentle manner, leaving the fish skin dermal structure and native bioactive lipids intact.20-23 Once grafted, the fish skin is gradually infiltrated by cells and incorporated into the tissue prior to the next application. Human and fish skin are structurally similar due to evolutionary homology (Figure 1).24 An important difference is that cold water fish skin is naturally richer in omega-3 polyunsaturated fatty acids, which are precursors to specialized pro-resolving lipid mediators that have a role in host defense, resolution of inflammation, remodeling of tissue, and pain response.24-26 Two double-blind randomized controlled trials on acute wounds showed that fish skin grafts promote significantly faster healing compared with a porcine intestinal submucosa product and an amniotic/chorion membrane product.21,27
The graft is stable at room temperature for 3 years. It is applied to the wound bed following debridement and can be used with negative pressure wound therapy. The fish skin graft is held in place with a nonadherent contact layer or Steri-Strips (3M). Alternatively, it can be fastened with stitches or staples. The graft is bolstered or stacked in case of deep or cavernous wounds. The material itself is skin-like in appearance, robust and pliable, and difficult to tear. It can be easily cut or meshed and only requires brief hydration with saline before application.
Cost associated with DFUs
The total cost of DFU treatment in the United States is estimated to be at least $38 billion, with hospitalization costs being the largest factor.28,29 One study showed costs for patients with DFUs to be more than triple that of patients with DM but without ulcers.30 In addition to direct costs, there is a substantial indirect cost incurred due to loss of productivity, disability, and premature mortality.31
Role of cost simulations in deciding health care spending
Cost-benefit, cost-effectiveness, and cost-utility analyses can assist health care providers in making better evidence-based decisions by identifying, analyzing, and comparing the impact of different treatment options on public health and health care expenditure.32 In simple terms, a cost-effectiveness analysis compares 2 available treatment approaches, usually a standard method and a novel one, and asks the following: (A) is one more effective than the other?; and, if so, (B) is there a difference in cost? If a therapy is both cheaper and more effective, it should be recommended or at least strongly considered. If a therapy is more effective but also more expensive, one can take into account the payer’s willingness to pay (WTP) per gained unit of health; if the extra cost per unit gained is lower than the WTP, the added expenditure can be considered acceptable.33-35
Definitions of cost and utility
While comparative economic analyses are becoming increasingly more important in decision-making, cohesive and unified guidelines on how to conduct such analyses are still lacking. Generally, cost-utility studies are considered to be the gold standard for measuring treatment cost effectiveness.36-39 A cost-utility analysis is a type of cost-effectiveness study that evaluates both cost and quality-adjusted life-years (QALYs). One QALY equals 1 year in perfect health and zero QALY represents death.40 Commonly referenced WTP values for 1 QALY in the United States are $50000 and $100000, while values in Europe are often lower.41-47 The cost perspective can either be that of the third-party payer (ie, insurance companies, governmental agencies, employers), or society. The societal perspective includes all incurred costs to society, including lost labor, and can be difficult to implement; the payer’s perspective is more commonly reported.31,35
Use of predictors of wound closure and cost benefit models
Several easy-to-apply predictors of healing have been described in wound care.48-50 These are often dependent on both the age and surface area of the wound. Using such established predictors of wound closure in comparative analyses has the potential to standardize cohorts across studies and reduce the effect of bias due to confounding variables. This method is used as a way of comparing the actual performance of an active tissue-based product with historically validated expectations for SOC in a population with DFUs treated at one wound care setting in the United States. By applying a weekly cost to the 2 therapies, potential cost savings with the new therapy can be projected.
Objective
The objective of this retrospective comparative cohort study was to compare the rates of healing, number of amputations, and cost/utility in the treatment of DFUs using either SOC alone or intact fish skin treatments.
Methods
In this study, a Markov model was implemented together with a probabilistic sensitivity analysis (PSA) to compare the costs of fish skin grafts with SOC for the treatment of DFUs. The Markov model is particularly well suited to simulate processes in which probabilities for future states depend, in some part, on the present state. The cost-effectiveness of clinical application in the present study was evaluated by following disease progression, QoL, and cost accumulation over time. The model divides a simulated patient cohort into 4 discrete health states, each of which is associated with a cost and a utility (ie, QoL) for a patient in that state. At regular intervals, or cycles, patients may transition from one health state to another, and the corresponding costs and utilities are calculated for the new distribution of health states.51 The model was constructed using MATLAB (MATLAB 2019a, The MathWorks, Inc.).
Data
The present analysis was based on data collected in both a physician practice and a hospital setting between January 1, 2014, and December 31, 2018. Part of the cohort used in this analysis was already published in a retrospective study in 2019 but with less stringent inclusion criteria.52 The local institutional review board, in collaboration with the American Health Network of Indianapolis, approved the collection and storage of non-identifying patient information used in this analysis in REDCap (Vanderbilt University).
The inclusion criteria captured 55 patients with diabetes over 18 years of age who had fish skin grafts applied to their full-thickness foot ulcerations (distal to the ankle malleoli; n = 59). The most common locations of the wounds were (in order from most to least common) the hallux, the plantar (mid)foot, sub-first metatarsal head, and the dorsal foot. The remaining locations included the heel, toes, lateral foot, metatarsophalangeal joints, and minor amputation sites.
The average size of the wounds was 3.7 cm2 (range, 0.05–26.4 cm2), and 48% of the wounds had a duration of more than 2 months at the beginning of treatment. Of the wounds included, 53% were Wagner grade 1, 37% were grade 2, and 10% were grade 3. Of the 59 wounds, 55 (93%) eventually healed after an average of 11.3 weeks (SD = 9.1 weeks); 3 patients underwent an amputation and 1 entered palliative care. The wounds received an average of 5.5 applications of fish skin. Average age of patients was 52 years (range, 45–88 years) and the male/female ratio was 1.8.
Patients were followed for 20 weeks after initial presentation, or until fully healed, amputation, or death. If a patient still had an active ulcer at 20 weeks, medical records were checked to determine whether that patient eventually healed, underwent an amputation, or died within 52 weeks after initial presentation. Wound healing was defined as complete wound epithelialization according to the treating physician. Patients were excluded if they had partial-thickness wounds, were not followed for 20 weeks after initial presentation, their status after 52 weeks was unknown, or if their fish skin graft treatment did not meet the recommended criteria set by the investigators. Those criteria included at least 5 applications of fish skin, or applications at least once every 4 weeks on average if the patient healed or underwent an amputation before the 20-week time point. Patients were instructed to offload with the Aircast boot and foam insert (Plastazote; Zotefoams) or surgical shoe and foamor custom insert. Total contact casting was not applied. Patients were not excluded if they missed appointments. Furthermore, infection, poor nutrition or circulation, and lack of adherence to offloading did not influence inclusion in the present study.
Time horizon
A time horizon of 52 weeks was chosen in order to include costs that were incurred beyond 20 weeks. Because the time horizon was so short, cost and utility were not discounted.
Cycle time
A cycle time of 1 week was chosen to reflect the recommended 1-week interval between fish skin graft applications, as described in the product instructions for use.
Health states and transition probabilities
The present Markov model was built using 4 health states: DFU, Healed, Amputated, and Death (Figure 2). All patients started with DFUs from the beginning of the first cycle (week 1). For each cycle of the model, new health-state distributions were generated. During the first cycle, a patient with a DFU remained in the same state (ie, with an active DFU), healed, underwent amputation, or died. Those who had remained in the same, or initial, state (DFU) faced the same risks in the subsequent cycles. Of those who had healed or received an amputation, the patients either remained in those states (ie, healed or amputated) or passed away. The Death state was immutable. Each state transition was determined by applying the transition probabilities shown in Table 1.53,55-57 For each cycle, the number of patients in each state was calculated as the sum of those who remained in the state and those who joined the state, subtracting those who left the state. As data for the rates of recurrence for the retrospective cohort were not available, and in order to simplify the model, recurrence (ie, Healed to DFU) was not included. Probabilities for transition between model states were based on literature or retrospective data on the cohort treated with fish skin (Table 1).53,55-57 Since the majority of published DFU studies reported healing at 20 weeks, and the vast majority of DFU-related amputations occur within the first 20 weeks, the present authors created separate transition probability matrices for both the SOC and fish skin cohorts for weeks 1 to 20 and weeks 21 to 52.53
The most appropriate approach when creating a multi-state model with competing risks is to convert the probabilities for events over time, such as annual probabilities, to the transition probabilities for a series of shorter time periods by performing an eigendecomposition on the original probability.54 Weekly rates of healing in the fish skin-treated cohort were calculated directly from the retrospective data on 55 fish skin-treated patients included in this analysis using the healing probabilities from weeks 1 to 20 and weeks 21 to 52 and then applied the equation pn= 1-(1-p)1/n, where pn was the adjusted weekly rate and p was the probability of healing at week n using the previously mentioned MATLAB program.51 The healing probability was higher during weeks 1 to 20 than weeks 21 to 52 by a factor of 3.6, reflecting the challenging nature of the remaining wounds. As a comparable retrospective SOC cohort was not available, the present authors used baseline data from the patient cohort treated with fish skin upon presentation to predict their probability of healing by week 20 if they had received SOC instead of fish skin treatment using an equation created by Margolis et al.55 This equation predicts the probability of healing at 20 weeks of SOC treatment based on the Wagner grade, size, and age of the wound at presentation, factors which were all known for the retrospective fish skin treated cohort.55 The healing probability for the SOC cohort for weeks 21 to 52 was extrapolated by adjusting the probability from weeks 1 to 20 with the same factor as the reduction of healing that was observed for fish skin treatment (ie, 3.6). The transition probability for amputation was obtained from a 2005 paper by Margolis et al,53 which reported a total of 6.72% amputations (n = 1653), where 96% of these amputations occurred during the first 4 months of care. To more accurately represent this amputation probability in the present model, the authors approximated that 96% of amputations occurred during weeks 1 to 20 and the remaining 4% during weeks 21 to 52. These probabilities were used to perform the eigendecomposition for both time frames, and the resulting weekly rates were applied to both cohorts. Mortality rates for the Healed state were derived from an Agency for Healthcare Research and Quality study that analyzed mortality among patients with a DFU or lower extremity amputation.56 These rates were converted to reflect the probability of mortality for weeks 1 to 20, and 21 to 52, prior to eigendecomposition. The same mortality rates were applied to both the SOC and fish skin cohorts (Table 1).53,55-57 The hazard ratio was calculated as the ratio of the weekly healing probabilities of the fish skin cohort to SOC cohort at weeks 1 to 20, and weeks 21 to 52.
Costs
The present authors sought to identify the likely costs associated with SOC clinical treatments for patients with DFUs, including extremity amputations. Given the paucity of financial data in the medical literature, a medical literature review was conducted in order to identify all papers that contained such data through a search of PubMed for articles published between January 2000 to June 2018. After a thorough review, it was decided to exclude papers whose financial data was particularly dated (ie, before 2000) and may not reflect current methods the US health care system accounts for spending on products and services associated with wound care. Additionally, any papers that did not identify the perspective of the financial data that were collected (eg, payer or provider) or the payment regimen under which it was collected (eg, commercial insurance, managed care, self-pay, Medicare) or were not broadly representative of the entire US population (ie, only commercial insurance, only managed care, or only Medicare, etc.) were excluded. Ultimately, focus was placed on a large study by Carls et al.58 Study data were derived from the Thomson Reuters MarketScan Research Database, 2005 to 2008.58 The database contained the fully adjudicated health insurance claims from 14 522 commercial enrollees and 17127 Medicare enrollees with DFUs. The claims included inpatient medical, outpatient medical, and outpatient pharmacy costs. The weekly cost for patients with DFUs (without an amputation) was calculated to be $389.85 in July 2008. This figure was then updated for this analysis to the estimated weekly cost as of July 2019 using the US Bureau of Labor Statistics inflation calculator.57 The calculated weekly cost was $454.72 in 2019 dollars. From the same database, the total cost for patients with DFUs and amputations was assessed to be $65 427.65 when updated into 2019 dollars, which included surgical costs as well as postoperative care.58,59 The same costs of amputation were applied for both cohorts. The total cost of fish skin treatment was calculated as the cost for current SOC with the addition of the weekly cost of the fish skin application. The price for the treatment was based on the average sales price of the fish skin graft per square centimeter in 2019, which was $46.98. That average cost was calculated for the retrospective cohort by estimating and averaging the appropriate product size required for a full coverage of each wound with fish skin at presentation. Even though the average wound area would reduce over time as a result of healing, the average cost of fish skin was not reduced over time to reflect this. This was done to simplify the model. However, as a result, the treatment price will be overestimated over time. That cost of the graft was averaged for all patients and applied as a weekly cost, even though the frequency of treatments in the retrospective cohorts was only about once every 2.2 weeks. The estimated average weekly cost of fish skin was $252.40. As most of the other costs of wound care with fish skin would be the same as for SOC, the weekly cost of fish skin was simply added to the $454.72 weekly cost of SOC, giving a total weekly cost of $707.12 for fish skin treatment. For the model, the treatment costs for both cohorts were calculated by multiplying the proportion of the cohorts residing in each health state during each cycle by the weekly cost associated with that health state and summed over 52 weeks to obtain the total cost for the time horizon. The total cost of amputation was applied at the time of amputation. No costs were incurred for those in the Death state.
Quality-adjusted life-years
The QALYs for both cohorts were calculated for each cycle using utility variables obtained from the literature and the health-state distributions (Table 2).60,61 The decrement of utility values for active ulcers and amputations were subtracted from the utility value of type 2 diabetes without complications in order to obtain utilities for the states DFU and Amputated.
Probabilistic sensitivity analysis
Since calculating an output from the present Markov model from predetermined input variables would give a deterministic result, the present authors sought to examine what would happen to the model if those input variables fluctuated, thereby reflecting their natural uncertainty. Thus, a PSA using a Monte Carlo simulation was performed to incorporate that input-variable uncertainty. The model inputs were varied, and the simulation iteratively outputted new calculations. A total of 10000 iterations were performed.
During random sampling, a seed was set for reproducibility purposes, which created a dummy dataset that allowed a comparison of fish skin graft application with SOC in terms of incremental cost (accumulated cost of fish skin graft therapy—accumulated cost of SOC) and incremental effectiveness (accumulated utility fish skin graft therapy—accumulated utility of SOC). During each iteration of the PSA, model values were drawn randomly based on the following parameter distributions: cost was assumed to have a gamma distribution because cost parameters are positive and skewed; utility variables were given a beta distribution because beta distributions take values from 0 to 1; and hazard ratios were given normal distributions.62
For sensitivity analysis, the present authors sought to include standard deviation values for costs. While standard deviation values for costs can be obtained from the retrospective data, this information was not available for SOC and amputations in the referenced work by Carls et al.58 However, great variability in cost was observed between different sources and publications for treatment of DFUs as well as for minor versus major limb amputations.57,63-66 To assess model robustness and account for such uncertainties, all costs were varied by 50% for sensitivity analysis, standard error (SE) for beta distribution of utility values was estimated from confidence intervals reported in the literature (Table 2), and SE of hazard ratio values was estimated from healing probabilities of the retrospective data and SOC cohorts using the equation (SE)= √(1/E1+1/E2), where E1 and E2 are the proportions healed within each cohort.60,61
Results
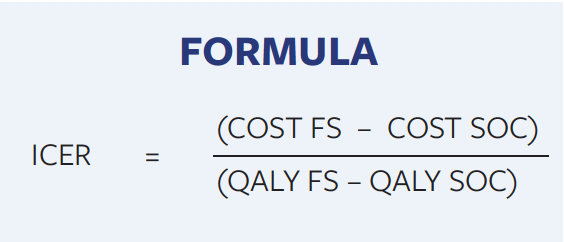
For SOC and fish skin therapy, the deterministic model gave an expected average cost of $15075 compared with $11210 per DFU and 0.605 versus 0.676 QALYs per patient, respectively, over the time horizon (Figure 3D). At the end of the year, 24% of the SOC cohort remained in the DFU state as opposed to 5.3% of the cohort treated with fish skin (Figure 3C). Since patients who do not heal will continue to need treatment after 52 weeks, the difference in treatment costs will continue to increase beyond the 1-year time horizon. At week 21, 50% of the SOC cohort had healed, while the cohort treated with fish skin experienced the same healing rate between weeks 8 and 9 (Figure 3A). Total amputations after 52 weeks were 6.9% for the SOC cohort and 4.6% for the fish skin cohort (Figure 3B). The results of the Monte Carlo simulation are depicted in the incremental cost-effectiveness ratio (ICER) scatter plots (Figure 4A), which is further explained in Figure 4B. The incremental cost-effectiveness ratio values are calculated as the difference of costs between fish skin and SOC treatments divided by the difference in QALYs between the 2 treatments (Formula).
Data points concentrated in the second quadrant indicates that a new treatment is less effective and more costly than the old one. In this case, the new treatment should be rejected.62 A concentration of data points in the third quadrants means a new treatment is less costly but also less effective. Clustering of data points in the fourth quadrant indicates that the new treatment is more effective and less costly (ie, new treatment dominates) and should be recommended. A scatterplot concentrated in the first quadrant indicates that the new treatment is both more effective and more costly than the old one (Figure 4B). The data points from this simulation landed in the first and fourth quadrant. By plotting a cost-effectiveness acceptability curve, it can be determined that there is a 93.6% probability that fish skin treatment is cost effective at a WTP of $100000 per gained QALY and 86% at $50000. Also, 71.4% of the data points indicate the fish skin treatment is more economical than SOC (Figure 5).
Discussion
Fish skin grafting is a relatively new technology and has been shown to be both safe and effective, even in patients with complicated wounds scheduled for major amputation.21,67,68 The present study used a Markov model with a 1-year time horizon to compare utility and cost from the payer’s perspective of SOC alone versus treatment with fish skin grafts. The main result was that fish skin therapy was more effective and incurred a lower total cost. The main cost reduction was due to quicker healing and a higher proportion of wounds closing, which led to fewer amputations within the year. Less time spent in the DFU state and fewer amputations also resulted in more QALYs collected in the fish skin-treated group. The long-term cost reduction of the DFU treatment observed here more than compensated for the upfront cost of the fish skin grafts. A sensitivity analysis demonstrated that the fish skin therapy was 93.6% likely to be cost effective at a WTP of $100000 per QALY and 71.4% likely to be cheaper compared with SOC.
Cost-benefit analyses have been applied to identify various treatment approaches, products, and technologies that could reduce costs and improve performance when applied as an adjunct to good standard wound care. Examples of the new treatment candidates showing promise include recombinant human platelet-derived growth factor gel, enzymatic debridement agents, various offloading devices, innovative wound dressings, primary prevention efforts, and negative pressure wound therapy.56,69-74 In particular, the cost effectiveness of several skin-like advanced wound products has been investigated with enthusiasm, as wound specialists increasingly reach for those alternatives when the standard approach of moist wound healing coupled with offloading and debridement fails.75 A meta-analysis of economic evaluations of different cell-based tissue products determined that their use reduced episode length and the occurrence of complications.76 Additional studies established that the savings due to this improved clinical outcome were sufficient to offset the increase in upfront costs of purchasing and applying these advanced products, echoing the results of the work presented here.77–80 Reaching a consensus on whether higher priced treatment options are cost effective has been challenging despite the many publications on the matter. Part of the problem is the heterogenous, and sometimes unclear, approaches used in different studies, making drawing any conclusions based on the results of meta-analyses problematic.81 The analysis presented in this paper is the first cost-benefit analysis ever published on fish skin grafts. Although the results would favor their inclusion in the care of difficult-to-heal wounds, this will have to be verified with a larger cohort. Fortunately, a large clinical study on hundreds of patients with DFUs has been launched in Europe, which will hopefully answer some of those questions.82
Limitations
The study has several inherent limitations. The model does not take the recurrence of wounds into account, which is a significant contributor to the economic burden of DFUs. The data are retrospective and not from a randomized control trial, which is the best study design for treatment evidence.83,84 However, the retrospective nature of the data might be considered an advantage because a well-performed, controlled trial produces data under perfect treatment circumstances, which are hard to replicate in the real world. In fact, the inclusion criteria of this study were very open, with nonadherence being a frequent issue with several patients. The transition probabilities for the patients treated with fish skin are based on a relatively small cohort of only 59 DFUs. Furthermore, the data came from one setting and may not be representative of US wound care practices at large. However, in a previous study, Margolis et al55 found that center variation has minimal effect on the likelihood of a wound healing. Additionally, the SOC cohort was simulated using values based on the literature rather than an actual control group treated at the same center. This is because the wound care center in the study, like most, has a policy of switching to more advanced therapy if wounds do not respond to SOC within a few weeks, so comparable SOC data were not available.
Conclusions
As statistician George Box famously claimed, “All models are wrong, but some are useful.” While no cost simulation will ever truly capture reality, a thoughtful and well-structured model based on real-world data and reliable variables from the literature can provide valuable insights and assist in decision making in regard to the care of patients with DFUs. As the prevalence and cost associated with DFUs continue to grow worldwide, it is vital that health care expenditure is used as effectively as possible. The cost simulation performed in this study found that fish skin is both more cost effective and more clinically effective than SOC alone in treating chronic DFUs. The advantage of using a simulation model such as the Markov model is that it is easy to update with new data, either when more data are available in the United States for comparing cost effectiveness in other countries, or to compare fish skin with other advanced wound therapies; future studies should focus on this.
Acknowledgments
Authors: Christopher Winters, DPM1; Robert S. Kirsner, MD, PhD2; David J. Margolis, MD, PhD3; and John C. Lantis, II, MD4
Affiliations: 1Ascension St. Vincent Hospital, Indianapolis, IN; 2University of Miami Miller School of Medicine, Miami, FL; 3University of Pennsylvania Perelman School of Medicine, Philadelphia, PA; 4 Mount Sinai/St. Luke’s Hospital Center, Icahn School of Medicine, New York City, NY
Correspondence: Christopher Winters, DPM, 12188-B N. Meridian Street, Suite 330, Carmel, IN 46032; soledoc1@gmail.com
Disclosure: No financial support was provided for this study. Dr. Winters, Dr. Kirsner, and Dr. Lantis all report fees from Kerecis, outside the scope of this submitted work.
References
1. Shaw JE, Sicree RA, Zimmet PZ. Global estimates of the prevalence of diabetes for 2010 and 2030. Diabetes Res Clin Pract. 2010;87(1):4–14. doi:10.1016/j.diabres.2009.10.007
2. World Health Organization. Global Report on Diabetes. World Health Organization; 2016. Accessed September 23, 2019. http://www.who.int/diabetes/global-report/en/
3. Leone S, Pascale R, Vitale M, Esposito S. Epidemiologia del piede diabetico. Epidemiology of diabetic foot. Infez Med. 2012;20 Suppl 1:8–13.
4. Peter-Riesch B. The diabetic foot: the never-ending challenge. Endocr Dev. 2016;31:108–134. doi:10.1159/000439409
5. National Institute for Health and Care Excellence. Diabetic foot problems: prevention and management. National Institute for Health and Care Excellence. August 26, 2015. Accessed September 16, 2019. https://www.nice.org.uk/guidance/ng19
6. Armstrong DG, Wrobel J, Robbins JM. Guest editorial: are diabetes-related wounds and amputations worse than cancer? Int Wound J. 2007;4(4):286–287. doi:10.1111/j.1742-481X.2007.00392.x
7. Kim SY, Kim TH, Choi JY, et al. Predictors for amputation in patients with diabetic foot wound. Vasc Specialist Int. 2018;34(4):109–116. doi:10.5758/vsi.2018.34.4.109
8. Yesil S, Akinci B, Yener S, et al. Predictors of amputation in diabetics with foot ulcer: single center experience in a large Turkish cohort. Hormones (Athens). 2009;8(4):286–295. doi:10.14310/horm.2002.1245
9. American Diabetes Association. Consensus Development Conference on Diabetic Foot Wound Care: 7-8 April 1999, Boston, Massachusetts. American Diabetes Association. Diabetes Care. 1999;22(8):1354–1360. doi:10.2337/diacare.22.8.1354
10. Van De Weg FB, Van Der Windt DA, Vahl AC. Wound healing: total contact cast vs. custom-made temporary footwear for patients with diabetic foot ulceration. Prosthet Orthot Int. 2008;32(1):3–11. doi:10.1080/03093640701318672
11. Sibbald RG, Ayello EA. Total contact cast for diabetic foot ulcers: an underused “gold standard.” Adv Skin Wound Care. 2019;32(6):247. doi:10.1097/01.ASW.0000558272.10192.c5
12. Ilonzo N, Patel M, Lantis JC 2nd. Managing the diabetic foot ulcer: how best practices fit the real 2018 United States. Surg Technol Int. 2018;32:49–59.
13. Petrakis I, Kyriopoulos IJ, Ginis A, Athanasakis K. Losing a foot versus losing a dollar; a systematic review of cost studies in diabetic foot complications. Expert Rev Pharmacoecon Outcomes Res. 2017;17(2):165–180. doi:10.1080/14737167.2017.1305891
14. Frykberg RG, Zgonis T, Armstrong DG, et al. Diabetic foot disorders. A clinical practice guideline (2006 revision). J Foot Ankle Surg. 2006;45(5 Suppl):S1–S66. doi:10.1016/S1067-2516(07)60001-5
15. Snyder RJ, Kirsner RS, Warriner RA 3rd, Lavery LA, Hanft JR, Sheehan P. Consensus recommendations on advancing the standard of care for treating neuropathic foot ulcers in patients with diabetes. Ostomy Wound Manage. 2010;56(4 Suppl):S1–24.
16. Everett E, Mathioudakis N. Update on management of diabetic foot ulcers. Ann N Y Acad Sci. 2018;1411(1):153–165. doi:10.1111/nyas.13569
17. Game FL, Apelqvist J, Attinger C, et al. Effectiveness of interventions to enhance healing of chronic ulcers of the foot in diabetes: a systematic review. Diabetes Metab Res Rev. 2016;32 Suppl 1:154–168. doi:10.1002/dmrr.2707
18. Gottrup F, Apelqvist J. Present and new techniques and devices in the treatment of DFU: a critical review of evidence. Diabetes Metab Res Rev. 2012;28 Suppl 1:64–71. doi:10.1002/dmrr.2242
19. 510(k) Premarket Notification. Accessed September 10, 2020. https://www.accessdata.fda.gov/scripts/cdrh/cfdocs/cfpmn/pmn.cfm?ID=K132343
20. Center for Biologics Evaluation and Research. Source Animal, Product, Preclinical, and Clinical Issues Concerning the Use of Xenotransplantation Products in Humans. U.S. Food and Drug Administration. Published May 17, 2019. Accessed September 10, 2020. https://www.fda.gov/regulatory-information/search-fda-guidance-documents/source-animal-product-preclinical-and-clinical-issues-concerning-use-xenotransplantation-products
21. Baldursson BT, Kjartansson H, Konrádsdóttir F, Gudnason P, Sigurjonsson GF, Lund SH. Healing rate and autoimmune safety of full-thickness wounds treated with fish skin acellular dermal matrix versus porcine small-intestine submucosa: a noninferiority study. Int J Low Extrem Wounds. 2015;14(1):37–43. doi:10.1177/1534734615573661
22. Magnússon S, Baldursson BT, Kjartansson H, et al. Affrumað roð: eðliseiginleikar sem styðja vefjaviðgerð. Decellularized fish skin: characteristics that support tissue repair. Laeknabladid. 2015;101(12):567–573. doi:10.17992/lbl.2015.12.54
23. Magnusson S, Baldursson BT, Kjartansson H, Rolfsson O, Sigurjonsson GF. Regenerative and antibacterial properties of acellular fish skin grafts and human amnion/chorion membrane: implications for tissue preservation in combat casualty care. Mil Med. 2017;182(S1):383–388. doi:10.7205/MILMED-D-16-00142
24. Rakers S, Gebert M, Uppalapati S, et al. ‘Fish matters’: the relevance of fish skin biology to investigative dermatology. Exp Dermatol. 2010;19(4):313–324. doi:10.1111/j.1600-0625.2009.01059.x
25. Ji RR, Xu ZZ, Strichartz G, Serhan CN. Emerging roles of resolvins in the resolution of inflammation and pain. Trends Neurosci. 2011;34(11):599–609. doi:10.1016/j.tins.2011.08.005
26. Serhan CN. Pro-resolving lipid mediators are leads for resolution physiology. Nature. 2014;510(7503):92–101. doi:10.1038/nature13479
27. Kirsner RS, Margolis DJ, Baldursson BT, et al. Double-blind, prospective, randomized clinical trial on 170 acute wounds shows significantly faster healing rate with intact fish skin compared to human amniotic membrane. Presented at: The National American Podiatric Medical Association Annual Scientific Meeting. Published online July 12, 2018.
28. Driver VR, Fabbi M, Lavery LA, Gibbons G. The costs of diabetic foot: the economic case for the limb salvage team. J Vasc Surg. 2010;52(3 Suppl):17S–22S. doi:10.1016/j.jvs.2010.06.003
29. Harrington C, Zagari MJ, Corea J, Klitenic J. A cost analysis of diabetic lower-extremity ulcers. Diabetes Care. 2000;23(9):1333–1338. doi:10.2337/diacare.23.9.1333
30. Ramsey SD, Newton K, Blough D, et al. Incidence, outcomes, and cost of foot ulcers in patients with diabetes. Diabetes Care. 1999;22(3):382–387. doi:10.2337/diacare.22.3.382
31. Patton D, Eltahir O, Moore Z, Sorensen J. Methodological approaches for assessing the cost of diabetic foot ulcers: a systematic literature review. J Wound Care. 2019;28(5):261–266. doi:10.12968/jowc.2019.28.5.261
32. Rabarison KM, Bish CL, Massoudi MS, Giles WH. Economic evaluation enhances public health decision making. Front in Public Health. 2015;3:164. doi:10.3389/fpubh.2015.00164
33. Laupacis A, Feeny D, Detsky AS, Tugwell PX. How attractive does a new technology have to be to warrant adoption and utilization? Tentative guidelines for using clinical and economic evaluations. CMAJ. 1992;146(4):473–481.
34. Laupacis A, Feeny D, Detsky AS, Tugwell PX. Tentative guidelines for using clinical and economic evaluations revisited. CMAJ. 1993;148(6):927–929.
35. Carter MJ. Cost-effectiveness research in wound care: definitions, approaches, and limitations. Ostomy Wound Manage. 2010;56(11):48–59.
36. Research on the comparative effectiveness of medical treatments: issues and options for an expanded federal role. Congressional Budget Office. December 18, 2007. Accessed September 5, 2019. https://www.cbo.gov/publication/41655
37. Siegel JE, Weinstein MC, Russell LB, Gold MR. Recommendations for reporting cost-effectiveness analyses. Panel on Cost-Effectiveness in Health and Medicine. JAMA. 1996;276(16):1339–1341. doi:10.1001/jama.276.16.1339
38. Weinstein MC, Siegel JE, Gold MR, Kamlet MS, Russell LB. Recommendations of the Panel on Cost-effectiveness in Health and Medicine. JAMA. 1996;276(15):1253–1258.
39. Russell LB, Gold MR, Siegel JE, Daniels N, Weinstein MC. The role of cost-effectiveness analysis in health and medicine. Panel on Cost-Effectiveness in Health and Medicine. JAMA. 1996;276(14):1172–1177.
40. Zeckhauser R, Shepard D. Where now for saving lives? Law Contemp Probl. 1976;40(4):5. doi:10.2307/1191310
41. Marseille E, Larson B, Kazi DS, Kahn JG, Rosen S. Thresholds for the cost–effectiveness of interventions: alternative approaches. Bull World Health Organ. 2015;93(2):118–124. doi:10.2471/BLT.14.138206
42. Ubel PA, Hirth RA, Chernew ME, Fendrick AM. What is the price of life and why doesn’t it increase at the rate of inflation? Arch Intern Med. 2003;163(14):1637–1641. doi:10.1001/archinte.163.14.1637
43. Shiroiwa T, Sung YK, Fukuda T, Lang HC, Bae SC, Tsutani K. International survey on willingness-to-pay (WTP) for one additional QALY gained: what is the threshold of cost effectiveness? Health Econ. 2010;19(4):422–437. doi:10.1002/hec.1481
44. Cameron D, Ubels J, Norström F. On what basis are medical cost-effectiveness thresholds set? Clashing opinions and an absence of data: a systematic review. Glob Health Action. 2018;11(1):1447828. doi:10.1080/16549716.2018.1447828
45. Muurinen JM. Demand for health: a generalised Grossman model. J Health Econ. 1982;1(1):5–28. doi:10.1016/0167-6296(82)90019-4
46. McDougall JA, Furnback WE, Wang BCM, Mahlich J. Understanding the global measurement of willingness to pay in health. J Mark Access Health Policy. 2020;8(1):1717030. doi:10.1080/20016689.2020.1717030
47. Organisation for Economic Co-operation and Development. Health expenditure. OECD. Accessed September 10, 2020. https://www.oecd.org/els/health-systems/health-expenditure.htm
48. Das SK, Yuan YF, Li MQ. Predictors of delayed wound healing after successful isolated below-the-knee endovascular intervention in patients with ischemic foot ulcers. J Vasc Surg. 2018;67(4):1181–1190. doi:10.1016/j.jvs.2017.08.077
49. Mohammad Zadeh M, Lingsma H, van Neck JW, Vasilic D, van Dishoeck AM. Outcome predictors for wound healing in patients with a diabetic foot ulcer. Int Wound J. 2019;16(6):1339–1346. doi:10.1111/iwj.13194
50. Sheehan P, Jones P, Caselli A, Giurini JM, Veves A. Percent change in wound area of diabetic foot ulcers over a 4-week period is a robust predictor of complete healing in a 12-week prospective trial. Diabetes Care. 2003;26(6):1879–1882. doi:10.2337/diacare.26.6.1879
51. Sonnenberg FA, Beck JR. Markov models in medical decision making: a practical guide. Med Decis Making. 1993;13(4):322–338. doi:10.1177/0272989X9301300409
52. Michael S, Winters C, Khan M. Acellular fish skin graft use for diabetic lower extremity wound healing: a retrospective study of 58 ulcerations and a literature review. Wounds. 2019;31(10):262–268.
53. Margolis DJ, Allen-Taylor L, Hoffstad O, Berlin JA. Diabetic neuropathic foot ulcers and amputation. Wound Repair Regen. 2005;13(3):230–236. doi:10.1111/j.1067-1927.2005.130303.x
54. Chhatwal J, Jayasuriya S, Elbasha EH. Changing cycle lengths in state-transition models: challenges and solutions. Med Decis Making. 2016;36(8):952–964. doi:10.1177/0272989X16656165
55. Margolis DJ, Allen-Taylor L, Hoffstad O, Berlin JA. Diabetic neuropathic foot ulcers: predicting which ones will not heal. Am J Med. 2003;115(8):627–631. doi:10.1016/j.amjmed.2003.06.006
56. Gilligan AM, Waycaster CR, Motley TA. Cost-effectiveness of becaplermin gel on wound healing of diabetic foot ulcers. Wound Repair Regen. 2015;23(3):353–360. doi:10.1111/wrr.12285
57. Margolis DJ, Malay DS, Hoffstad OJ, et al. Incidence of diabetic foot ulcer and lower extremity amputation among Medicare beneficiaries, 2006 to 2008: data points #2. In: Data Points Publication Series. Agency for Healthcare Research and Quality (US); 2011. Accessed October 18, 2019. http://www.ncbi.nlm.nih.gov/books/NBK65149/
58. Carls GS, Gibson TB, Driver VR, et al. The economic value of specialized lower-extremity medical care by podiatric physicians in the treatment of diabetic foot ulcers. J Am Podiatr Med Assoc. 2011;101(2):93–115. doi:10.7547/1010093
59. CPI Inflation Calculator. United States Bureau of Labor Statistics. Accessed October 18, 2019. https://data.bls.gov/cgi-bin/cpicalc.pl
60. Clarke P, Gray A, Holman R. Estimating utility values for health states of type 2 diabetic patients using the EQ-5D (UKPDS 62). Med Decis Making. 2002;22(4):340–349. doi:10.1177/0272989X0202200412
61. Bagust A, Beale S. Modelling EuroQol health-related utility values for diabetic complications from CODE-2 data. Health Econ. 2005;14(3):217–230. doi:10.1002/hec.910
62. Graves N, Wloch C, Wilson J, et al. A cost-effectiveness modelling study of strategies to reduce risk of infection following primary hip replacement based on a systematic review. Health Technol Assess. 2016;20(54):1–144. doi:10.3310/hta20540
63. Hicks CW, Selvarajah S, Mathioudakis N, et al. Trends and determinants of costs associated with the inpatient care of diabetic foot ulcers. J Vasc Surg. 2014;60(5):1247–1254.e2. doi:10.1016/j.jvs.2014.05.009
64. Flack S, Apelqvist J, Keith M, Trueman P, Williams D. An economic evaluation of VAC therapy compared with wound dressings in the treatment of diabetic foot ulcers. J Wound Care. 2008;17(2):71–78. doi:10.12968/jowc.2008.17.2.28181
65. Gordois A, Scuffham P, Shearer A, Oglesby A, Tobian JA. The health care costs of diabetic peripheral neuropathy in the US. Diabetes Care. 2003;26(6):1790–1795. doi:10.2337/diacare.26.6.1790
66. Horswell RL, Birke JA, Patout CA Jr. A staged management diabetes foot program versus standard care: a 1-year cost and utilization comparison in a state public hospital system. Arch Phys Med Rehabil. 2003;84(12):1743–1746. doi:10.1016/s0003-9993(03)00477-5
67. Dorweiler B, Trinh TT, Dünschede F, et al. The marine Omega3 wound matrix for treatment of complicated wounds. Gefasschirurgie. 2018;23(Suppl 2):46–55. doi:10.1007/s00772-018-0428-2
68. Kirsner RS, Margolis DJ, Baldursson BT, et al. Fish-skin grafts compared to human amnion/chorion membrane allografts: a double-blind, prospective, randomized, clinical trial of acute wound healing. Wound Repair Regen. 2020;28(1):75–80. doi:10.1111/wrr.12761
69. Motley TA, Gilligan AM, Lange DL, Waycaster CR, Dickerson JE. Cost-effectiveness of clostridial collagenase ointment on wound closure in patients with diabetic foot ulcers: economic analysis of results from a multicenter, randomized, open-label trial. J Foot Ankle Res. 2015;8:7. doi:10.1186/s13047-015-0065-x
70. Removable Off-loading devices for diabetic foot ulcers: a review of clinical and cost-effectiveness. CADTH.ca. Updated September 30, 2019. Accessed September 14, 2020. https://www.cadth.ca/removable-loading-devices-diabetic-foot-ulcers-review-clinical-and-cost-effectiveness
71. Guest JF, Singh H, Vowden P. Potential cost-effectiveness of using a collagen-containing dressing in managing diabetic foot ulcers in the UK. J Wound Care. 2018;27(3):136–144. doi:10.12968/jowc.2018.27.3.136
72. Barshes NR, Saedi S, Wrobel J, Kougias P, Kundakcioglu OE, Armstrong DG. A model to estimate cost-savings in diabetic foot ulcer prevention efforts. J Diabetes Complications. 2017;31(4):700–707. doi:10.1016/j.jdiacomp.2016.12.017
73. Liu S, He CZ, Cai YT, et al. Evaluation of negative-pressure wound therapy for patients with diabetic foot ulcers: systematic review and meta-analysis. Ther Clin Risk Manag. 2017;13:533–544. doi:10.2147/TCRM.S131193
74. Kirsner RS, Delhougne G, Searle RJ. A cost-effectiveness analysis comparing single-use and traditional negative pressure wound therapy to treat chronic venous and diabetic foot ulcers. Wound Manag Prev. 2020;66(3):30–36.
75. Kirsner RS. Clinical evidence for and cost-effectiveness of advanced cellular tissue products for the treatment of diabetic foot ulcers. Am J Manag Care. 2018;24(14 Spec No.):SP607–SP608.
76. Langer A, Rogowski W. Systematic review of economic evaluations of human cell-derived wound care products for the treatment of venous leg and diabetic foot ulcers. BMC Health Serv Res. 2009;9:115. doi:10.1186/1472-6963-9-115
77. Rice JB, Desai U, Ristovska L, et al. Economic outcomes among Medicare patients receiving bioengineered cellular technologies for treatment of diabetic foot ulcers. J Med Econ. 2015;18(8):586–595. doi:10.3111/13696998.2015.1031793
78. Frykberg RG, Marston WA, Cardinal M. The incidence of lower-extremity amputation and bone resection in diabetic foot ulcer patients treated with a human fibroblast-derived dermal substitute. Adv Skin Wound Care. 2015;28(1):17–20. doi:10.1097/01.ASW.0000456630.12766.e9
79. Redekop WK, McDonnell J, Verboom P, Lovas K, Kalo Z. The cost effectiveness of Apligraf treatment of diabetic foot ulcers. Pharmacoeconomics. 2003;21(16):1171–1183. doi:10.2165/00019053-200321160-00003
80. Gilligan AM, Waycaster CR, Landsman AL. Wound closure in patients with DFU: a cost-effectiveness analysis of two cellular/tissue-derived products. J Wound Care. 2015;24(3):149–156. doi:10.12968/jowc.2015.24.3.149
81. Woods T-J, Tesfay F, Speck P, Kaambwa B. Economic evaluations considering costs and outcomes of diabetic foot ulcer infections: a systematic review. PLoS One. 2020;15(4):e0232395. doi:10.1371/journal.pone.0232395
82. Kerecis Ltd. A Multi-Center, Randomized Controlled Clinical Trial Evaluating the Effect of Omega3 Wound Fish Skin Graft in the Treatment of Diabetic Foot Ulcers. ClinicalTrials.gov; 2020. Accessed September 13, 2020. https://clinicaltrials.gov/ct2/show/NCT04133493
83. Burns PB, Rohrich RJ, Chung KC. The levels of evidence and their role in evidence-based medicine. Plast Reconstr Surg. 2011;128(1):305–310. doi:10.1097/PRS.0b013e318219c171
84. Petrisor B, Bhandari M. The hierarchy of evidence: levels and grades of recommendation. Indian J Orthop. 2007;41(1):11–15. doi:10.4103/0019-5413.30519
Sign Up Today


