The Role of Imaging in Ventricular Tachycardia Ablation
© 2024 HMP Global. All Rights Reserved.
Any views and opinions expressed are those of the author(s) and/or participants and do not necessarily reflect the views, policy, or position of EP Lab Digest or HMP Global, their employees, and affiliates.
EP LAB DIGEST. 2024;24(5):14-15.
The mechanistic understanding of ventricular tachycardia (VT) in structural heart disease has evolved over the past 40 years. Central to this understanding is the concept of myocardial scar allowing for reentry.1-3 This concept has informed subsequent mapping and ablation of VT over the past few decades. Many techniques have been subsequently developed to identify the isthmus responsible for reentrant VT, including entrainment, pace mapping, and electroanatomic mapping (EAM), as well as more recently, isochronal late activation mapping (ILAM) and decrement evoked potentials (DEEP) mapping. This review aims to also discuss the evolving role of imaging in guiding VT ablation, its intraprocedural incorporation, and our center’s experience.
Scar-mediated VT can often be challenging to ablate. Approximately 69% of VTs are not hemodynamically tolerated.4 As a result, techniques to allow for successful ablation of these VTs focus on substrate abnormalities, including late potentials, local abnormal ventricular activity (LAVA), ILAM, and DEEP. However, these mapping techniques are dependent on type of mapping catheter used and the associated size and spacing of their electrodes.5 In addition, recurrence rates after ablation can often be as high as 41%6 and complication rates can range from 7%-10% in this population.7 Finally, some VTs may not be inducible during electrophysiology (EP) study. Image-guided ablation offers the opportunity to plan and improve safety as well as success of VT ablation.
Choice of Imaging Modality: Cardiac Computed Tomography (CT)
There are generally 2 options for cardiac imaging, including the use of cardiac CT and cardiac magnetic resonance imaging (MRI). The advantages of cardiac CT include ease of performing the test with wide availability, relatively rapid acquisition, and high spatial resolution (<0.4 mm voxel size).8 CT can identify left ventricular thrombus as well and provides anatomic information, including locations of coronary arteries, veins, and the phrenic nerve. It provides dynamic data such as wall thickness in end-systole, end-diastole, wall thickening, and wall motion. Perfusion data from CT helps identify scar tissue and border zone areas.9 Scar-based assessment is performed using wall thinning or late iodine enhancement. CT is also useful for subxiphoid epicardial access, and provides additional information including size of the xiphoid bone, skin to pericardium distance, possible trajectory of the needle, and location of adjacent structures such as liver and other abdominal organs. Epicardial fat thickness and pericardial thickening/calcification are other important factors that can also be visualized with CT.
Disadvantages of cardiac CT include that it may not be as reliable as cardiac MRI for determining scar location in nonischemic cardiomyopathy and it does not show edema. Device-related artifacts from CT imaging can be reduced by using dual energy, noise suppression, beam hardening/scatter reduction techniques, modern reconstruction algorithms (projection completion, iterative reconstruction), and use of convolutional neural network-derived algorithms.10

Choice of Imaging Modality: Cardiac MRI
Considered the gold standard in cardiac imaging, cardiac MRI can identify scar based on late gadolinium enhancement (LGE) and show edema on T2 weighted imaging; location and extent of LGE (endo, mid vs epicardial) and border zones can help with preprocedural access planning for ablation.11 Like CT, it can also demonstrate left ventricular thrombus, anatomic, and cardiac functional data.12 Unfortunately, MRI is not widely available, takes longer for acquisition, and requires breath holding. MRI also requires specialized protocols when scanning nonconditional devices. Scanning with devices also can lead to significant artifact, limiting interpretation of the study. Device-related artifact with MRI can be reduced with appropriate patient positioning by elevating the arm above the shoulder and moving the device away from the heart. Specific MRI sequence selection such as STIR or Dixon, fast spin echo (FSE), fast spoiled gradient echo, and further changing parameters such as decreasing field strength, increasing bandwidth, matrix, and increasing gradient amplitude have shown to reduce cardiovascular implantable electronic device-related artifact.13 Cardiac MRI also does not provide the same spatial resolution as compared to CT with coronary and phrenic nerve anatomy.
Studies Using Image Integration
Early reports of image integration using both cardiac CT and MRI14 in both ischemic and nonischemic cardiomyopathy patients demonstrated feasibility of using cardiac imaging to guide VT ablation. Specifically, areas of diseased substrate correlated with both wall thinning by CT and LGE by MRI. Investigators also found that CT was useful to guide epicardial ablation providing additional coronary anatomy information. Since then, 2 commercially available imaging software platforms, inHEART and ADAS 3D, have become available. Both platforms require cardiac imaging to be performed prior to the planned VT ablation with processing using proprietary software followed by integration into the EAM.
Image-guided VT ablation with both platforms has been and continues to be extensively studied. In a small 2-center study using inHEART, 49 patients underwent VT ablation and were noted to have faster procedure times with integrated cardiac imaging, with no difference in VT-free survival at the end of 19 ± 8 months.15 In another series of 9 patients with VT who underwent complete activation maps and also had cardiac CT to identify wall thinning and channels, investigators showed that VT isthmuses were found within the CT channels (>1 mm wall thickness) with 100% sensitivity.16 An early prospective study of 84 patients that used cardiac MRI with ADAS software found that procedure times and VT inducibility at the end of ablation were significantly less in the group that underwent cardiac MRI-guided (without using EAM voltage information) ablation in comparison to hybrid CMR-EAM and EAM-only ablation.17
More recently, deceleration zones often associated with VT isthmuses were evaluated with regard to their relationship to wall thinning in both ischemic and nonischemic cardiomyopathy.18 Investigators found that deceleration zones did localize to areas of wall thinning in patients with ischemic cardiomyopathy, but less frequently in patients with nonischemic cardiomyopathy. Another recent study showed cardiac imaging may also be useful to predict hemodynamic decompensation by evaluating scar volume at the time of preprocedural imaging, with patients at the highest tertile of scar (>37.3 mL) having the greatest risk.19

Our Experience With Image Integration
We have found significant advantages to using imaging not only for preplanning, but for image integration into the EAMs created during the VT ablation procedure. Since 2021, our EP group has been using cardiac imaging with CT or MRI processed by inHEART to plan and perform VT ablation. Image acquisition is done on either 256-slice CT or 1.5T MRI scanner at the hospital in conjunction with our radiology department following a specialized protocol for image acquisition. With support from our IT team, we created a special order set within our Epic electronic health record that alerts our radiology team that a scan for planning VT ablation is being ordered. Once the scan is completed, radiology sends images anonymized electronically for processing. Usually within 1-2 days, post-processed imaging is available for download into the EAM.
Preplanning the VT ablation based on scar location has been a significant advantage of cardiac imaging for our group. Depending on location of scar, our team uses the imaging to plan endocardial or epicardial access, as well as approach to the left ventricle. We also use preprocedural imaging to notify our EP laboratory staff whether bipolar ablation or use of alcohol is being considered, especially in the setting of septal scar and associated VT.

During the procedure, the cardiac 3-dimensional model can be registered/fused to the EAM usually using the great cardiac vessels, eliminating the need for creating a complete anatomic map. Once the imaging is registered, we normally will perform ventricular stimulation at the beginning of the procedure. If the VT is tolerated, activation mapping is usually performed; however, if the VT is not tolerated, then the ablation is usually performed based on a combination of techniques discussed above, along with the use of imaging to guide ablation targeting.
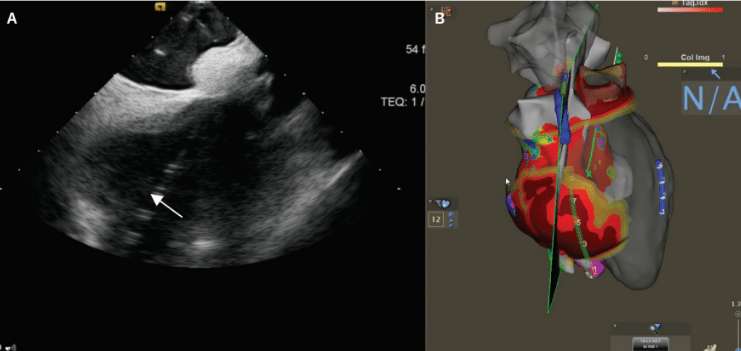
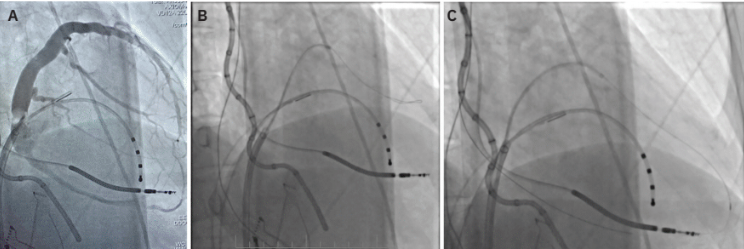
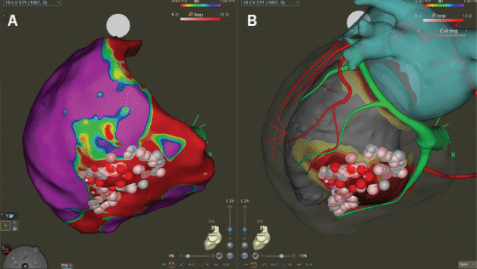
An example of a VT ablation performed using cardiac imaging is shown in Figure 1. A cardiac CT processed by inHEART is accompanied by an intracardiac ultrasound image. This patient had a large inferobasal left ventricular aneurysm with recurrent VT despite extensive endocardial ablation. She was brought back to the EP laboratory, and epicardial access was obtained using CO2 insufflation via intentional coronary vein exit (Figures 2A-C), as described by Silberbauer.20 The area of scar targeted for epicardial ablation is shown in Figure 3. The patient has been free of VT for over 12 months since her epicardial ablation and without any complications from the procedure.
Another example of VT ablation in a patient with hypertrophic cardiomyopathy is shown in Figure 4. Deep septal scar is demonstrated by late iodine enhancement on cardiac CT processed with inHEART. Ablation in this area terminated the patient’s clinical VT.

Summary and Future Directions
The field of VT ablation is rapidly evolving with numerous advancements. Cardiac imaging and its integration into the procedure provide several advantages over traditional VT ablation without imaging. Two trials are already underway to improve understanding of how best to use this technology: the inEurHeart trial and VOYAGE study are both randomized multicenter studies evaluating the use of integrated cardiac imaging for VT ablation.
Additionally, improvements in cardiac imaging will continue to provide even better scar delineation and anatomic information. Dual-source photon-counting CT promises to provide increased spatial resolution, with improved contrast to noise ratios. Additional investigation into understanding the physiologic implications of wall thinning and LGE will continue to help improve the VT ablation procedure.
Disclosure: The authors have completed and returned the ICMJE Form for Disclosure of Potential Conflicts of Interest. Dr Tolat reports stock or stock options (shareholder <$1000) in inHEART (Bordeaux, Fr).
References
1. de Bakker JMT, van Capflle FJL, Janse MJ, et al. Macroreentry in the infarcted human heart: the mechanism of ventricular tachycardias with a “focal” activation pattern. J Am Coll Cardiol. 1991;18(4):1005-1014. doi:10.1016/0735-1097(91)90760-7
2. Josephson ME, Horowitz LN, Farshidi A, Kastor JA. Recurrent sustained ventricular tachycardia. 1. Mechanisms. Circulation. 1978;57(3):431-440. doi:10.1161/01.CIR.57.3.431
3. Stevenson WG, Friedman PL, Sager PT, et al. Exploring postinfarction reentrant ventricular tachycardia with entrainment mapping. J Am Coll Cardiol. 1997;29(6):1180-1189. doi:10.1016/S0735-1097(97)00065-X
4. Stevenson WG, Wilber DJ, Natale A, et al. Irrigated radiofrequency catheter ablation guided by electroanatomic mapping for recurrent ventricular tachycardia after myocardial infarction: the multicenter Thermocool ventricular tachycardia ablation trial. Circulation. 2008;118(25):2773-2782. doi:10.1161/CIRCULATIONAHA.108.788604
5. Tschabrunn CM, Roujol S, Dorman NC, et al. High- resolution mapping of ventricular scar: comparison between single and multielectrode catheters. Circ Arrhythm Electrophysiol. 2016;9(6):10.1161/CIRCEP.115.003841 e003841. doi:10.1161/CIRCEP.115.003841
6. Quinto L, Sanchez-Somonte P, Alarcón F, et al. Ventricular tachycardia burden reduction after substrate ablation: predictors of recurrence. Hear Rhythm. 2021;18(6):896-904. doi:10.1016/j.hrthm.2021.02.016
7. Sciria CT, Kogan EV, Ip JE, et al. Trends and outcomes of catheter ablation of ventricular tachycardia in patients with ischemic and nonischemic cardiomyopathy. Circ Arrhythmia Electrophysiol. 2022;15(4):e010742. doi:10.1161/CIRCEP.121.010742
8. Kowalewski C, Ascione C, Nuñez-Garcia M, et al. Advanced imaging integration for catheter ablation of ventricular tachycardia. Curr Cardiol Rep. 2023;25(6):535-542. doi:10.1007/S11886-023-01872-Z
9. Tian J, Jeudy J, Smith MF, et al. Three-dimensional contrast-enhanced multidetector CT for anatomic, dynamic, and perfusion characterization of abnormal myocardium to guide ventricular tachycardia ablations. Circ Arrhythm Electrophysiol. 2010;3(5):496-504. doi:10.1161/CIRCEP.109.889311
10. Lossau Née Elss T, Nickisch H, Wissel T, Morlock M, Grass M. Learning metal artifact reduction in cardiac CT images with moving pacemakers. Med Image Anal. 2020;61:101655. doi:10.1016/J.MEDIA.2020.101655
11. Mahida S, Sacher F, Dubois R, et al. Cardiac imaging in patients with ventricular tachycardia. Circulation. 2017;136(25):2491-2507. doi:10.1161/CIRCULATIONAHA.117.029349/-/DC1
12. Fakess S, O’Loughlin M, Tolat A. Left ventricular thrombus following radiofrequency ventricular tachycardia ablation. HeartRhythm Case Rep. 2022;8(6):441-444. doi:10.1016/j.hrcr.2022.03.013
13. Lee EM, Ibrahim ESH, Dudek N, et al. Improving MR image quality in patients with metallic implants. Radiographics. 2021;41(4):E126-E137. doi:10.1148/RG.2021200092
14. Cochet H, Komatsu Y, Sacher F, et al. Integration of merged delayed-enhanced magnetic resonance imaging and multidetector computed tomography for the guidance of ventricular tachycardia ablation: a pilot study. J Cardiovasc Electrophysiol. 2013;24(4):419-426. doi:10.1111/jce.12052
15. Berte B, Cochet H, Dang L, et al. Image-guided ablation of scar-related ventricular tachycardia: towards a shorter and more predictable procedure. J Interv Card Electrophysiol. 2020;59(3):535-544. doi:10.1007/s10840-019-00686-w
16. Takigawa M, Duchateau J, Sacher F, et al. Are wall thickness channels defined by computed tomography predictive of isthmuses of postinfarction ventricular tachycardia? Heart Rhythm. 2019;16(11):1661-1668. doi:10.1016/j.hrthm.2019.06.012
17. Soto-Iglesias D, Penela D, Jáuregui B, et al. Cardiac magnetic resonance-guided ventricular tachycardia substrate ablation. JACC Clin Electrophysiol. 2020;6(4):436-447. doi:10.1016/J.JACEP.2019.11.004
18. Maher TR, Freedman BL, Locke AH, et al. Correlation between functional substrate mapping and cardiac computed tomography–derived wall thinning for ventricular tachycardia ablation. JACC Clin Electrophysiol. 2023;9(9):1878-1889. doi:10.1016/J.JACEP.2023.05.018
19. John LA, John II, Tedford RJ, et al. Substrate imaging before catheter ablation of ventricular tachycardia: risk prediction for acute hemodynamic decompensation. JACC Clin Electrophysiol. 2023;9(8):1684-1693. doi:10.1016/J.JACEP.2023.03.023
20. Silberbauer J, Gomes J, O’Nunain S, et al. Coronary vein exit and carbon dioxide insufflation to facilitate subxiphoid epicardial access for ventricular mapping and ablation: first experience. JACC Clin Electrophysiol. 2017;3(5):514-521. doi:10.1016/J.JACEP.2016.11.002


